




How Long Does It Take to Sell a House in Caledon?
July 2026 shows 36 listing days on average — but property type, community, price, condition, and marketing can move an individual result. See the current Caledon data and how to plan around it.
What's Inside
- Current Caledon Days on Market
- July 2026 Market Snapshot
- Monthly and Year-to-Date Context
- DOM by Property Type
- DOM by Caledon Community
- 5 Factors That Speed Up Your Sale
- 5 Factors That Slow Down Your Sale
- Seasonal Patterns in Caledon
- How Pricing Affects Timeline
- Marketing Impact on Speed
- Caledon Sale Timeline Estimator
- What You Can vs. Can't Control
- Kevin's Track Record
- How Caledon Compares Nearby
- Frequently Asked Questions
- Related Resources
1. Current Caledon Days on Market
Days on Market (DOM) measures the time from listing to a firm transaction for sales entered in the TRREB MLS system during the reporting period. In Caledon, all home types averaged 36 listing days in July 2026.
That 36-day figure is a municipal benchmark, not a deadline or a property-specific forecast. A home's likely timeline also depends on its property type, exact community, price range, condition, lot profile, showing access, documentation, and the competing listings buyers can choose from.
July also recorded 55 sales, a $1,230,122 average sale price, and a 95% average sale-to-list ratio across all Caledon home types.
Data source: TRREB Peel regional market report, Caledon page, July 2026. Figures may be revised in later TRREB publications. See the full Caledon market report.
2. July 2026 Market Snapshot
| Measure | July 2026 | How to Read It |
|---|---|---|
| Average listing days | 36 days | Current all-home Caledon benchmark |
| Sales | 55 | Firm transactions entered during July |
| Average sale price | $1,230,122 | Average across all home types |
| Median sale price | $1,110,000 | Midpoint of July sale prices |
| New listings | 210 | New MLS listings entered during July |
| Active listings | 471 | Active inventory at month end |
| Average sale-to-list | 95% | Average selling price divided by average listing price for firm sales |
The useful conclusion is not that every Caledon home should sell in exactly 36 days. It is that July provides a verified comparison point. Your pricing and launch plan should then narrow the evidence to the closest recent sales and active competition for your specific property.
3. Monthly and Year-to-Date Context
| Period | Sales | Avg Price | Median Price | New Listings | SP/LP | Avg. LDOM |
|---|---|---|---|---|---|---|
| July 2026 | 55 | $1,230,122 | $1,110,000 | 210 | 95% | 36 days |
| 2026 YTD through July | 432 | $1,158,240 | $1,049,000 | 1,441 | 96% | 37 days |
July's 36-day average was close to the 37-day year-to-date average through July. The monthly average price was higher than the year-to-date average, while the July sale-to-list ratio was one percentage point lower. Keep the periods separate: monthly data describes July activity, while year-to-date figures combine January through July.
For a seller, this supports a measured plan: launch with property-matched evidence, watch buyer response closely in the first two weeks, and adjust only when the response and comparable set show a material positioning problem.
4. DOM by Property Type
Property type materially changes the benchmark. The July rows below come from the same TRREB Caledon page and should not be blended with the separately labelled community data in the next section.
| Property Type | Sales | Avg Price | New Listings | Active Listings | Avg. LDOM |
|---|---|---|---|---|---|
| All Home Types | 55 | $1,230,122 | 210 | 471 | 36 days |
| Detached | 35 | $1,455,714 | 183 | 413 | 41 days |
| Semi-Detached | 6 | $902,083 | 9 | 10 | 24 days |
| Condo Townhouse | 1 | $584,990 | 1 | 8 | 31 days |
| Attached/Row/Townhouse | 12 | $818,267 | 15 | 34 | 23 days |
| Link | 1 | $890,000 | 0 | 2 | 66 days |
Small category counts can move sharply. The one-sale condo-townhouse and link rows are current observations, not stable forecasts. Detached and all-home figures provide broader July context.
5. DOM by Caledon Community
Community figures use the latest available Q1 2026 TRREB community report, not July data. They are separated here so the reporting periods are explicit. TRREB does not report some statistics when there are two or fewer transactions.
| Community | Sales | Avg Price | New Listings | Active Listings | Avg. DOM |
|---|---|---|---|---|---|
| Alton | 1 | Not reported | 9 | 6 | Not reported |
| Bolton East | 21 | $951,226 | 56 | 35 | 30 days |
| Bolton North | 11 | $1,138,500 | 24 | 10 | 33 days |
| Bolton West | 18 | $1,006,633 | 45 | 18 | 35 days |
| Caledon East | 11 | $1,270,091 | 73 | 44 | 42 days |
| Inglewood | 3 | $1,265,000 | 7 | 5 | 31 days |
| Palgrave | 5 | $1,388,000 | 26 | 21 | 42 days |
| Rural Caledon | 71 | $1,205,764 | 232 | 150 | 50 days |
Bolton East, North, and West are separate TRREB communities and should not be collapsed into an unsupported combined Bolton figure. Alton had one Q1 sale, so a precise average price or DOM was not reported. Rural Caledon's 50-day Q1 average illustrates why acreage, services, access, documentation, and a more specialized buyer pool can lengthen evaluation.
Source: TRREB Caledon Community Housing Market Report, Q1 2026.
6. Five Factors That Can Speed Up Your Sale
Price from Property-Matched Evidence
Use recent sales and active competition that match the property type, community, price band, lot profile, condition, and rural services.
Present the Whole Property
Show the home, land, outbuildings, access, views, storage, and seasonal features with professional photography and video.
Remove Rural-Property Uncertainty
Prepare well, septic, survey, permit, utility, maintenance, and zoning information where applicable so qualified buyers can evaluate clearly.
Make Showings Practical
Offer workable notice, safe access, and a plan for driveways, gates, outbuildings, and rural-property tours.
Read the First Two Weeks
Track views, inquiries, showings, second visits, agent feedback, and competing listings, then correct weak positioning before the listing becomes stale.
The goal is not simply to sell faster. It is to create enough qualified attention early to protect price and terms while avoiding the discount that can follow an overexposed listing.
7. Five Factors That Can Slow Down Your Sale
Overpricing Against the Wrong Comparables
A broad municipal average can misprice a specialized property. Start with the closest credible sales and active alternatives.
Generic Presentation
A rural or estate listing needs to explain the land, outbuildings, setting, services, and lifestyle value, not only the interior rooms.
Restricted Showing Access
Narrow viewing windows and unclear access reduce the number of qualified buyers who can inspect the property confidently.
Unresolved Property Questions
Missing records or unclear answers about wells, septic systems, surveys, permits, zoning, or improvements can delay or stop an offer.
Waiting Too Long to Respond
Repeated objections about price, condition, presentation, or access should be evaluated against the comparable set before the listing loses momentum.
8. Seasonal Patterns in Caledon
Caledon has distinct seasonal patterns — and for rural and estate properties, they are more pronounced than in urban markets.
Spring (March–May): Peak Season
The busiest selling season. Fields green up, gardens bloom, and acreage properties show at their best. DOM typically drops 25–30% in spring. If your Caledon home is show-ready by mid-March, you will catch the peak buyer pool — including GTA families targeting September school moves and equestrian buyers preparing for the riding season. See the complete seasonal guide.
Summer (June–August): Steady but Selective
Summer buyers in Caledon are serious but distracted by cottage weekends and equestrian events. June is strong. July and August slow as families travel. For rural properties, summer also means mowing, maintaining access roads, and keeping ponds and drainage presentable. Price competitively if listing in late summer.
Fall (September–November): Second Wind
September brings a surge of buyers who missed spring. The fall colours make Caledon properties spectacular. The market rebounds through October. By November, activity tapers as winter maintenance concerns emerge. Fall is the second-best season to sell in Caledon — especially for properties with mature trees and scenic views.
Winter (December–February): Quiet but Committed
The slowest season by volume. Snow-covered acreage, frozen driveways, and limited showing visibility all extend DOM. Winter buyers are typically motivated — job relocations, divorces, urgent moves — but the total buyer pool is smaller. Fewer competing listings help, but the tradeoff is lower total interest. A well-presented winter listing with clear access and heating-system documentation can outperform seasonal averages.
When Is the Best Time to Sell?
Watch Kevin's guide to seasonal timing in the Caledon market:
"I have sold Caledon homes in January that sat unsold through the previous July. The season mattered less than the preparation. But if you have a choice, mid-March and early September are your power windows."
9. How Pricing Affects Your Timeline
Pricing affects both attention and negotiating leverage. In July 2026, Caledon homes sold for an average of 95% of listing price, but that municipal ratio does not determine what an individual home should ask or accept.
Use the First Two Weeks as a Feedback Window
Compare online engagement, inquiry quality, showing volume, second visits, agent feedback, new competition, and recent firm sales. If the response is materially weaker than the closest comparable properties, revisit the evidence before the listing becomes stale.
Choose Comparables Carefully
Separate detached subdivisions, rural acreage, estate properties, semi-detached homes, townhouses, and unique properties. Then narrow further by community, price band, condition, lot profile, services, access, and major improvements.
A price change should solve a demonstrated positioning problem, not follow an arbitrary calendar date. See the full pricing guide.
10. Marketing Impact on Sale Speed
Marketing quality affects who sees the property, how quickly qualified buyers understand it, and whether out-of-area purchasers can evaluate the opportunity before arranging a visit.
What a Caledon Marketing Plan Should Answer
- Why this property? The strongest home, land, outbuilding, access, setting, and lifestyle features.
- Why this location? Community, commuting, services, recreation, and buyer-relevant local context.
- Why this price? The closest active, sold, and expired comparables supporting the launch position.
- Why act now? Honest availability, current competition, showing response, and property-specific scarcity.
Kevin's Video Narrated VR Animated Online Showing system uses photography, guided video, virtual viewing, property-specific pages, social distribution, and direct buyer communication to make those answers easier to understand.
See Kevin's Marketing in Action
Watch how Video Narrated VR Animated Online Showings help out-of-area buyers evaluate a property before they travel.
11. Caledon Sale Timeline Estimator
Estimate How Long Your Home Will Take to Sell
The 36-day base is July 2026 TRREB all-home data. Adjustments are planning estimates, not TRREB forecasts.
12. What You Can Control vs. What You Can't
What You Can Control
- Listing price — the #1 factor in speed
- Home condition — paint, repairs, staging, rural access
- Marketing quality — photos, video, SEO, social, acreage-specific presentation
- Showing access — lockbox, flexible times, clear driveways
- Preparation timing — list when ready, not rushed
- Agent selection — experience with rural/estate properties, systems, track record
What You Cannot Control
- Market conditions — buyer/seller balance
- Interest rates — mortgage affordability for move-up buyers
- Seasonal demand — natural cycles, especially for acreage
- Neighbourhood trends — new development, infrastructure, school boundaries
- Buyer pool size — who is looking for rural properties right now
- Competing listings — how many similar acreage or estate homes are available
You cannot control the market, but you can control preparation, pricing, presentation, showing access, and marketing. Track those decisions against current buyer response and comparable listings. Factor in the costs of selling when deciding which improvements are worth the investment.
"I tell every Caledon seller: control the controllables and accept the rest. The market is the market. But your price, your presentation, and your marketing are choices. Make good ones."
13. Kevin's Data-Led Selling Plan
A useful track record discussion should connect evidence to the decisions that affect your sale: the comparable set, launch price, preparation plan, presentation, showing access, buyer targeting, and response during the first two weeks.
Property-Specific Timeline
Estimate timing from the closest recent sales and active competition rather than promising the municipal average.
Launch-Ready Preparation
Resolve documentation, repair, staging, access, and presentation issues before the listing enters the market.
Full-Property Marketing
Show the home, land, outbuildings, setting, and lifestyle value to local and out-of-area buyers.
Evidence-Based Adjustments
Use buyer response and current competition to decide whether positioning needs to change.
Why Didn't My House Sell?
Watch Kevin diagnose common reasons listings lose momentum and how the preparation, pricing, and marketing plan can be rebuilt.
Read Kevin's reviews — Questions to ask before hiring an agent
14. What to Compare Before You List
Nearby-area averages can be useful background, but they are less important than the properties buyers will compare directly with your home.
| Comparison Layer | What to Match | Why It Matters |
|---|---|---|
| Property type | Detached, semi-detached, attached/row/townhouse, condo townhouse, link, or unique rural/estate | July DOM ranged materially by type |
| Community | Exact TRREB community or the closest credible micro-area | Buyer pool, services, access, and price expectations differ |
| Price band | Homes competing for the same qualified buyers | Higher and specialized price points can have smaller pools |
| Lot and services | Acreage, outbuildings, access, well, septic, utilities, and zoning | Rural-property evaluation requires additional evidence |
| Condition and presentation | Renovation level, maintenance, staging, photography, and documentation | Buyers compare readiness and perceived risk |
| Current competition | Active, conditional, recently sold, expired, and relisted properties | The choice set changes throughout the listing period |
See the full Caledon market report or request a property-specific evaluation.
15. Frequently Asked Questions
TRREB's average LDOM reflects the number of listing days for firm transactions entered during the reporting period. It is useful as a benchmark, but an individual home's likely timeline depends on property type, community, price, condition, lot, services, access, presentation, and competition.
It is the July 2026 all-home average. Whether that is fast or slow for your property depends on the closest comparable set. In the same July report, detached homes averaged 41 days and attached/row/townhouses averaged 23.
In July 2026, Caledon detached homes averaged 41 listing days, semi-detached homes 24, attached/row/townhouses 23, and condo townhouses 31. Monthly category counts differ, so use the figures as current context rather than a guarantee.
The latest available TRREB Caledon community report in the source library is quarterly. Labelling it separately prevents Q1 community figures from being mistaken for July data.
TRREB does not report some statistics when there are two or fewer transactions. Alton had one Q1 sale, so a precise average price or DOM figure would not be supported.
Yes. In the Q1 2026 community report, Rural Caledon averaged 50 DOM. Land, access, outbuildings, services, zoning, records, and a more specialized buyer pool can lengthen evaluation.
Price from property-matched evidence, prepare rural-property records where applicable, present the whole property professionally, make showings practical, target the likely buyer, and read the first two weeks of response carefully.
Review evidence continuously, especially during the first 14 days. Repeated feedback, weak showing conversion, stronger competing listings, and recent firm sales are more useful than waiting for an arbitrary day count.
No. The 95% figure is a July municipal average across firm sales. It does not predict the negotiation on an individual property. Your result depends on the launch price, property-specific demand, condition, presentation, competition, and offer terms.
Compare your home with the closest recent sales and active competition, then account for property type, exact community, price band, lot profile, condition, services, access, and the preparation and marketing plan. Request a free Caledon timeline estimate.
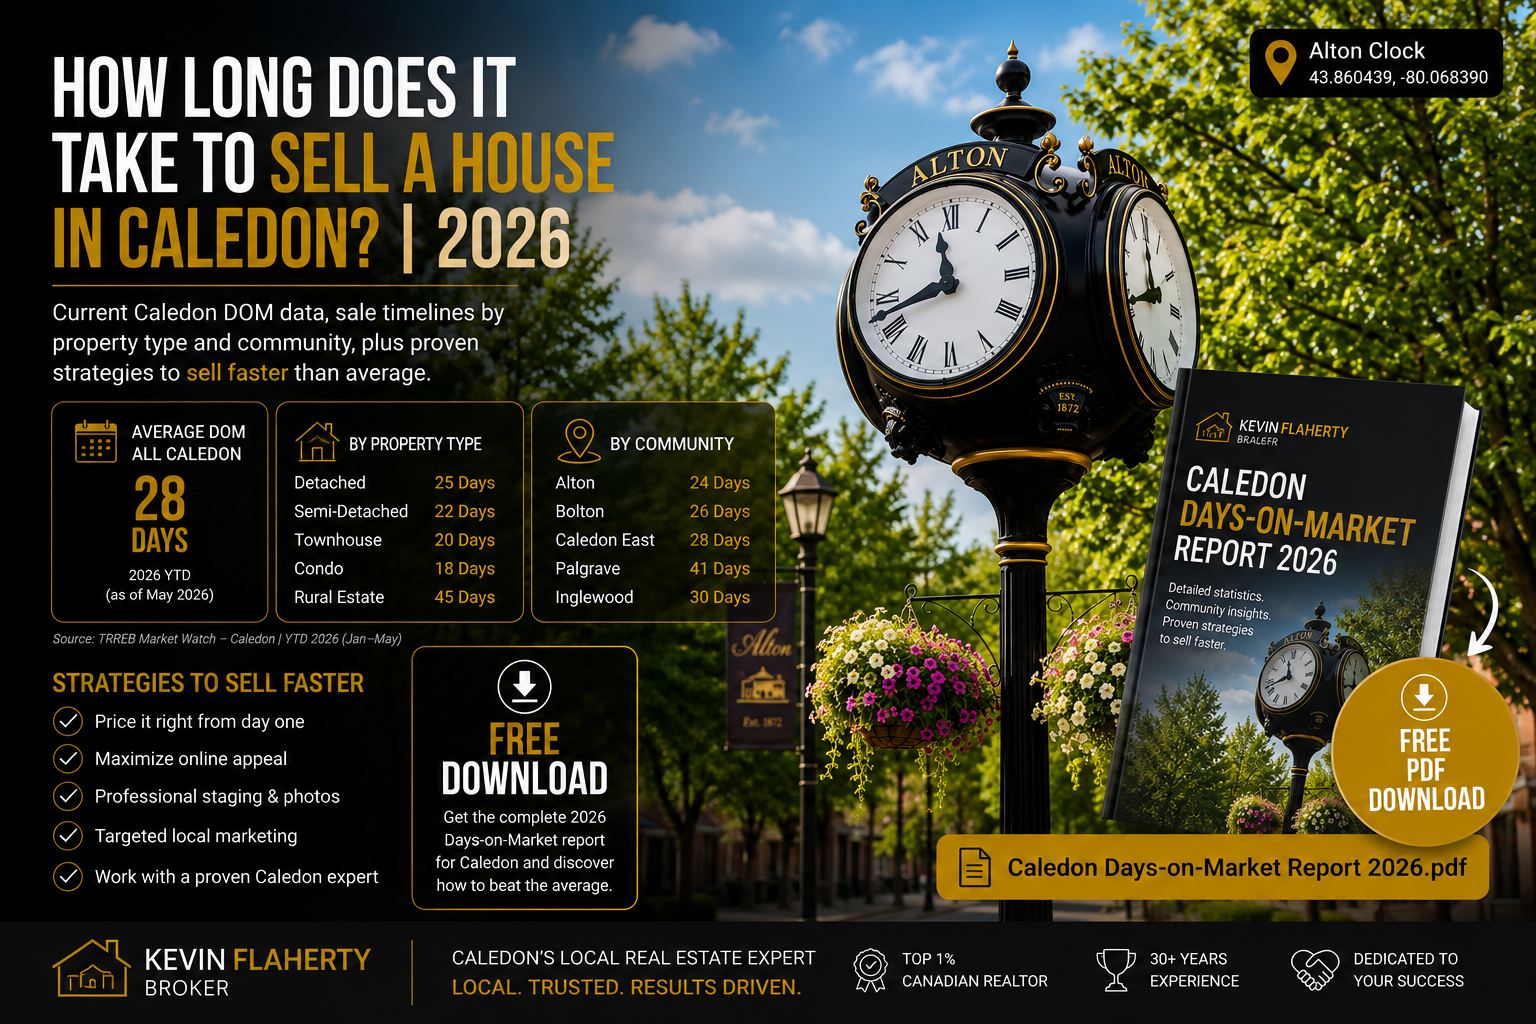
Free Caledon Days-on-Market Report
Get the redesigned guide with verified July 2026 DOM data, separately labelled Q1 community context, and a practical plan for selling around the 36-day average.
Download Free PDFInstant access. No spam. Unsubscribe anytime.
Want to Beat the 36-Day Average?
Get a free opinion of value and timeline estimate for your Caledon home — based on recent sales in your exact community.
Get Free EstimateCall Kevin directly: 226-270-6433