


What You Will Learn
- Why Pricing Strategy Matters More in Bolton
- How GTA Buyers Compare Bolton to Brampton & Vaughan
- Bolton Pricing Band Analyzer Tool
- Pricing Strategy by Sub-Community
- The $25K Threshold Effect
- Using the Sale-to-List Ratio as a Pricing Signal
- Watch: How to Get TOP DOLLAR
- 7 Pricing Mistakes Bolton Sellers Make
- Access All Bolton Sold Data
- What Clients Say
- More Bolton Selling Guides
- Frequently Asked Questions
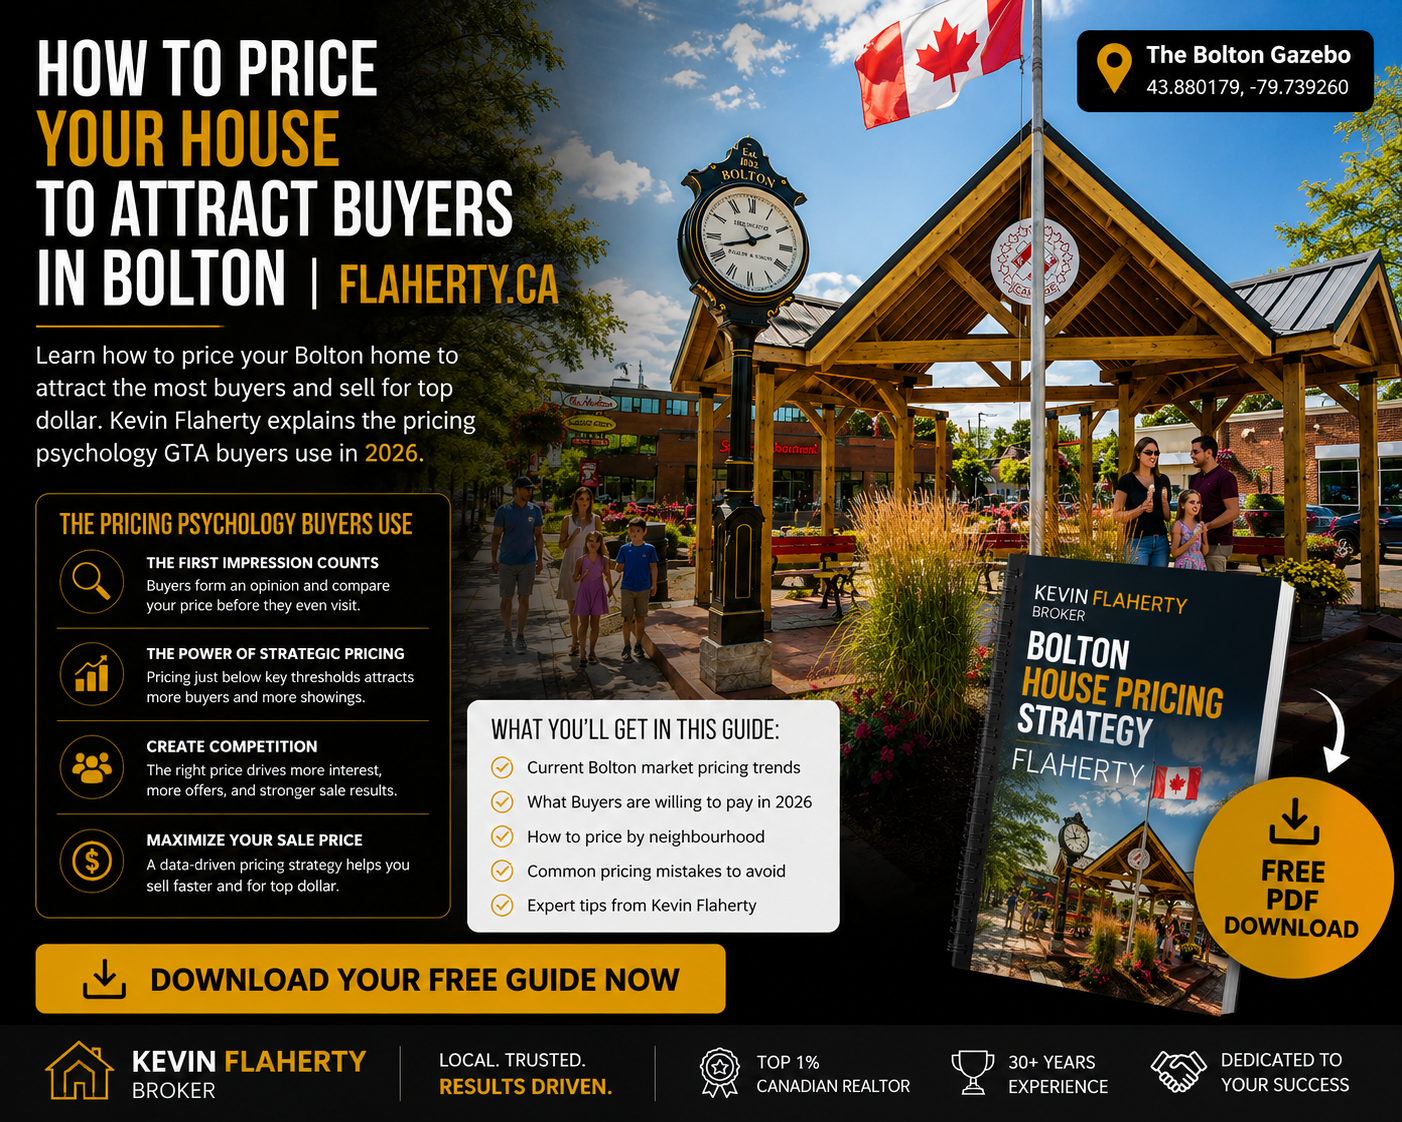
Why Does Pricing Strategy Matter More in Bolton Than in the GTA?
Bolton is not a simple market to price. Unlike a downtown Toronto condo where 50 nearly identical units sold in the same building last year, Bolton homes are priced against a moving target — GTA buyers who are simultaneously comparing your home to listings in Brampton, Vaughan, and Caledon. A $15,000 mispricing in Bolton does not just slow your sale; it can cost you $40,000 in final net proceeds once you factor in carrying costs, price reductions, and the stigma of a listing that has been sitting.
The Bolton market in 2026 operates at a 99.2% sale-to-list ratio when homes are priced correctly from day one. That number drops to 96.1% for homes that require a price reduction — a difference of $29,760 on a $960,000 home. The data is unambiguous: correct pricing on day one is the single highest-leverage decision a Bolton seller makes.
Correctly priced Bolton homes
Homes requiring price reduction
On a $960,000 Bolton home
Correctly priced Bolton homes
How Do GTA Buyers Compare Bolton to Brampton and Vaughan When Pricing?
The majority of Bolton buyers are GTA relocators — families priced out of Brampton and Vaughan who are searching for more space, a quieter community, and a shorter commute to Highway 400 or 427. They are not comparing your Bolton home to other Bolton homes in isolation. They are running a three-way comparison: Bolton vs. Brampton vs. Vaughan.
Understanding this comparison is the foundation of Bolton pricing strategy. A buyer who can afford $975,000 in Bolton can also afford a $940,000 semi-detached in Brampton or a $960,000 townhome in Woodbridge. Your pricing must justify the Bolton premium — which is real, but only up to a point.
| Market | Avg Detached Price | Avg DOM | S/L Ratio | Buyer Perception |
|---|---|---|---|---|
| Bolton (correctly priced) | $960,000 | 26 days | 99.2% | Best value: space + community |
| Brampton (detached) | $920,000–$950,000 | 22–28 days | 98.5% | Urban convenience, smaller lots |
| Vaughan / Woodbridge | $980,000–$1,050,000 | 24–32 days | 98.0% | Prestige, amenities, higher price |
| Caledon (rural) | $1,100,000–$1,400,000 | 28–38 days | 96–98% | Rural lifestyle, acreage premium |
| Bolton (overpriced by 3%) | $988,800 list → $960K sold | 55–70 days | 96.1% | Loses to Brampton on value |
GTA buyers will pay a Bolton premium of 3–8% over comparable Brampton homes for the community lifestyle, school quality, and lot size. Price above that window and you lose the buyer to Brampton. Price below it and you leave money on the table. The pricing strategy is to land precisely inside that window — which requires knowing current Brampton and Vaughan comparables, not just Bolton comparables.
Which Buyer Pool Does Your Bolton Asking Price Target?
Enter your planned asking price to see which buyer pool you are targeting, how many active Bolton buyers are in that price band, estimated days on market, and whether you are above or below the psychological threshold for your sub-community.
How Does Pricing Strategy Differ Across Bolton East, West, and North?
Bolton's three sub-communities have meaningfully different price bands, buyer profiles, and tolerance for overpricing. Using the wrong comparable set — or applying Bolton-wide averages to a specific sub-community — is one of the most common and costly pricing errors.
| Sub-Community | Optimal List Range | Avg DOM (correct price) | Avg DOM (overpriced 3%) | Typical Reduction | Primary Buyer Profile |
|---|---|---|---|---|---|
| Bolton East | $950K–$1,050K | 24–28 days | 55–70 days | $28,500–$35,000 | GTA upgraders, young families |
| Bolton West | $880K–$960K | 28–35 days | 60–80 days | $24,000–$30,000 | First-time buyers, downsizers |
| Bolton North | $850K–$940K | 30–40 days | 65–85 days | $22,000–$28,000 | Value buyers, commuters |
A Bolton East home listed at $1,020,000 is correctly priced for that market. The same home in Bolton North at $1,020,000 is overpriced by $80,000–$100,000 — and will sit. Bolton East real estate commands a premium because of newer builds, larger lots, and proximity to top-rated schools. Bolton North and Bolton West have their own strengths but different price ceilings.

Access All Bolton Sold Data
See exactly what every home in Bolton sold for — the same data your agent uses. Compare your home to real sold comparables in Bolton East, West, and North before you price.
Get Access to All SOLD InformationWhat Is the $25,000 Threshold Effect and How Does It Affect Your Sale Price?
Online home search platforms (Realtor.ca, HouseSigma, Zolo) filter listings by price bands in $25,000 or $50,000 increments. This creates a phenomenon that experienced Bolton agents understand well: a home listed at $999,000 appears in searches up to $1,000,000, while a home listed at $1,001,000 disappears from that search entirely.
The $25,000 threshold effect means that pricing at $974,900 instead of $980,000 can double your buyer pool — because you appear in the $950,000–$975,000 search band rather than the $975,000–$1,000,000 band, which has fewer active buyers in Bolton's current market.
- $849,900 — captures $800K–$850K buyers
- $899,900 — captures $850K–$900K buyers
- $949,900 — captures $900K–$950K buyers
- $974,900 — captures $950K–$975K buyers
- $999,900 — captures $975K–$1M buyers
- $1,049,900 — captures $1M–$1.05M buyers
- $855,000 — misses both $850K and $875K bands
- $905,000 — falls between two search bands
- $976,000 — loses $950K–$975K buyers
- $1,002,000 — loses all sub-$1M buyers
- $1,055,000 — falls between $1M and $1.1M bands
- $985,000 — misses the $975K–$1M sweet spot
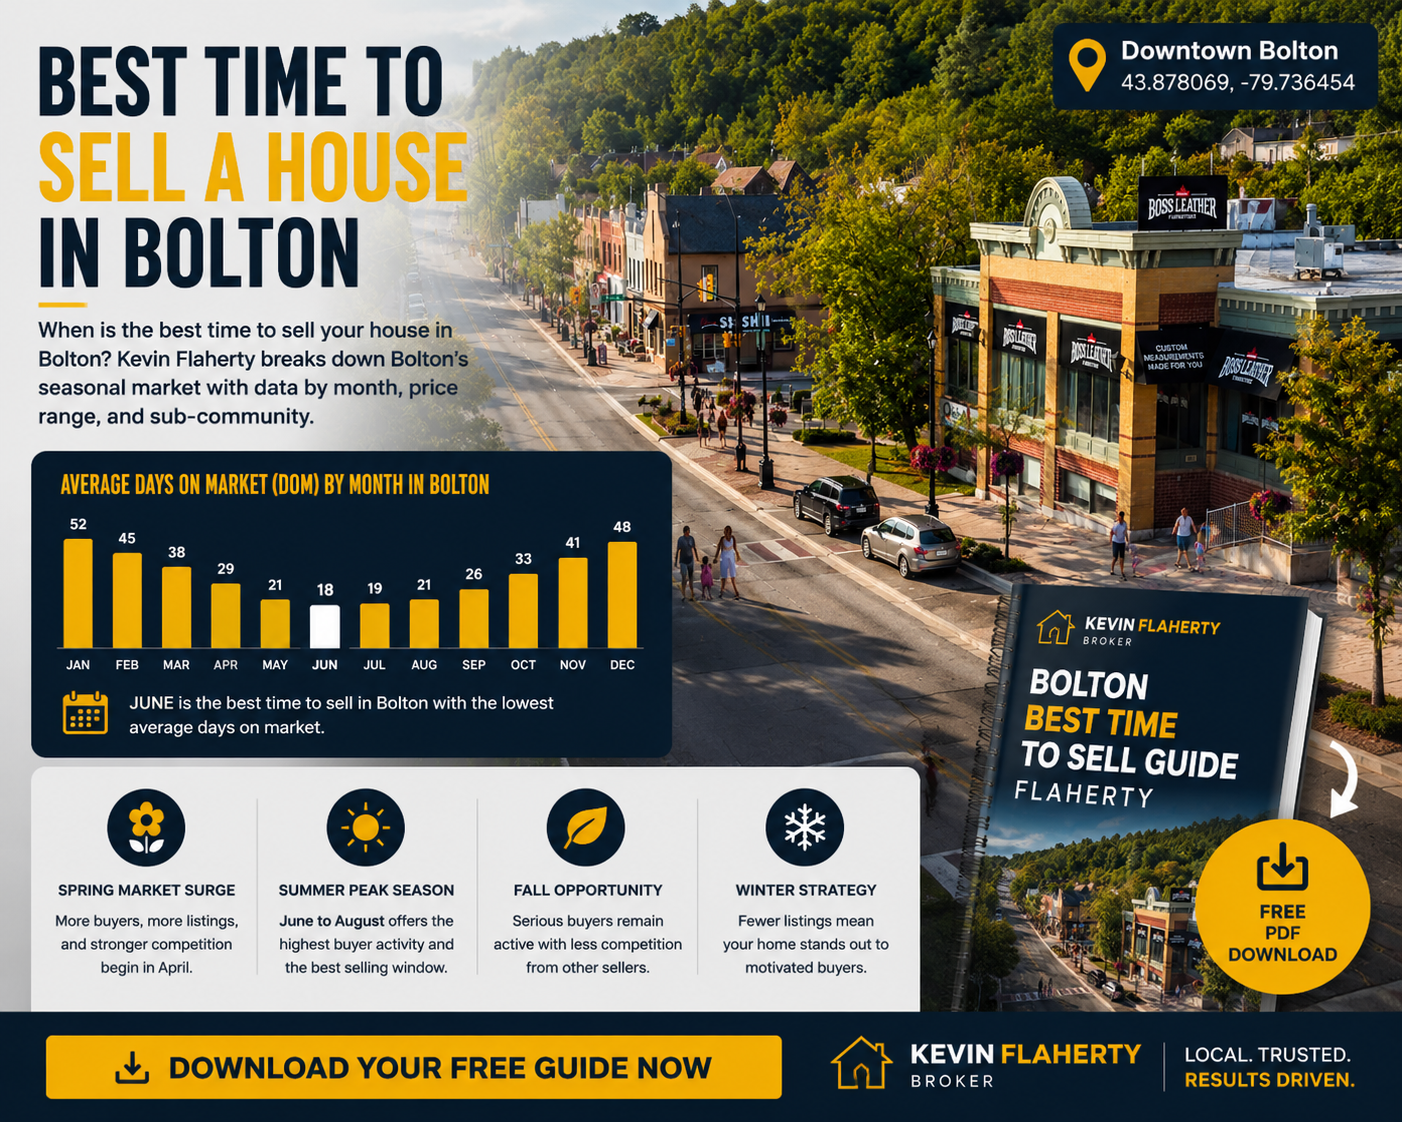
How Do You Use the Sale-to-List Ratio as a Pricing Signal in Bolton?
The sale-to-list ratio is the most honest pricing signal in the Bolton market. It tells you, in real time, whether buyers think homes are priced correctly, too high, or too low. A ratio above 100% means buyers are competing and bidding over asking. A ratio below 97% means sellers are overpricing and accepting less.
| S/L Ratio | Market Signal | Pricing Implication | Recommended Strategy |
|---|---|---|---|
| 102%+ | Strong seller's market | Buyers competing, multiple offers | Price at market — let competition drive it up |
| 99–101% | Balanced / slight seller's | Homes selling near asking | Price precisely — no room for error |
| 97–99% ◀ Current Bolton | Balanced market | Buyers negotiating 1–3% off | Price at top of range, expect negotiation |
| 94–97% | Buyer's market | Sellers reducing to sell | Price below comparable to attract offers |
| Below 94% | Strong buyer's market | Significant reductions common | Aggressive underpricing to generate activity |
Bolton's current sale-to-list ratio of 97–99% means the market is balanced with a slight buyer advantage. The correct strategy is to price at the top of the comparable range and expect a 1–2% negotiation. Pricing above the top of the range in this environment results in extended DOM and a final sale price below what you would have achieved with correct day-one pricing.
What Are the 7 Pricing Mistakes Bolton Sellers Make?
These are the most common — and most costly — pricing errors specific to the Bolton market. Each one is distinct from the evaluation mistakes and timing mistakes covered on other pages.
Pricing Against Brampton Without Accounting for the Bolton Premium
Bolton sellers often look at Brampton sold data and price $30,000–$50,000 above it, assuming Bolton always commands a premium. This is correct — but only within a specific window. When Brampton inventory rises and Bolton prices push above the premium window, GTA buyers choose Brampton. The Bolton premium is real but not unlimited, and it shifts with market conditions.
Ignoring Sub-Community Price Ceilings
Bolton East, West, and North have different price ceilings. A seller in Bolton North who prices their home based on Bolton East comparables will overprice by $80,000–$120,000. The sub-communities are close in distance but meaningfully different in buyer profile, lot size, school catchment, and price tolerance. Bolton East real estate consistently commands the highest prices in the Bolton market.
Falling Into a Threshold Trap
Pricing at $1,002,000 instead of $999,900 eliminates every buyer searching under $1,000,000 — which in Bolton's current market is the largest single buyer pool. The $25,000 search band effect is not theoretical; it is measurable in showing traffic data. Homes priced at threshold traps receive 30–40% fewer online views in the first 7 days, which is the most critical window for generating offers.
Pricing Above Appraisal Value
When a Bolton home sells conditionally and the buyer's lender orders an appraisal, the appraised value must support the purchase price. If you price above what an appraiser will support — typically 2–4% above recent comparable sales — the deal collapses at the financing condition. In Bolton's current market, appraisals are coming in tight. Pricing above appraisal value does not just risk the deal; it wastes 2–3 weeks of market time.
Mispricing Renovated vs. Unrenovated Homes
Bolton buyers in the $900K–$1.1M range are sophisticated. They know that a fully renovated kitchen adds $40,000–$60,000 in value — not $150,000. Sellers who invest $120,000 in renovations and expect a $200,000 price premium are consistently disappointed. The renovation premium in Bolton is real but capped by the sub-community price ceiling. A renovated home in Bolton North cannot be priced above the Bolton East ceiling regardless of finish quality.
Ignoring DOM as a Pricing Signal
When comparable Bolton homes are sitting at 45+ days on market, that is a direct signal that the market has rejected the current price level. Sellers who list at the same price as stale listings are pricing into a known failure. The correct approach is to identify the price at which comparable homes actually sold — not where they were listed — and use that as the ceiling, not the floor.
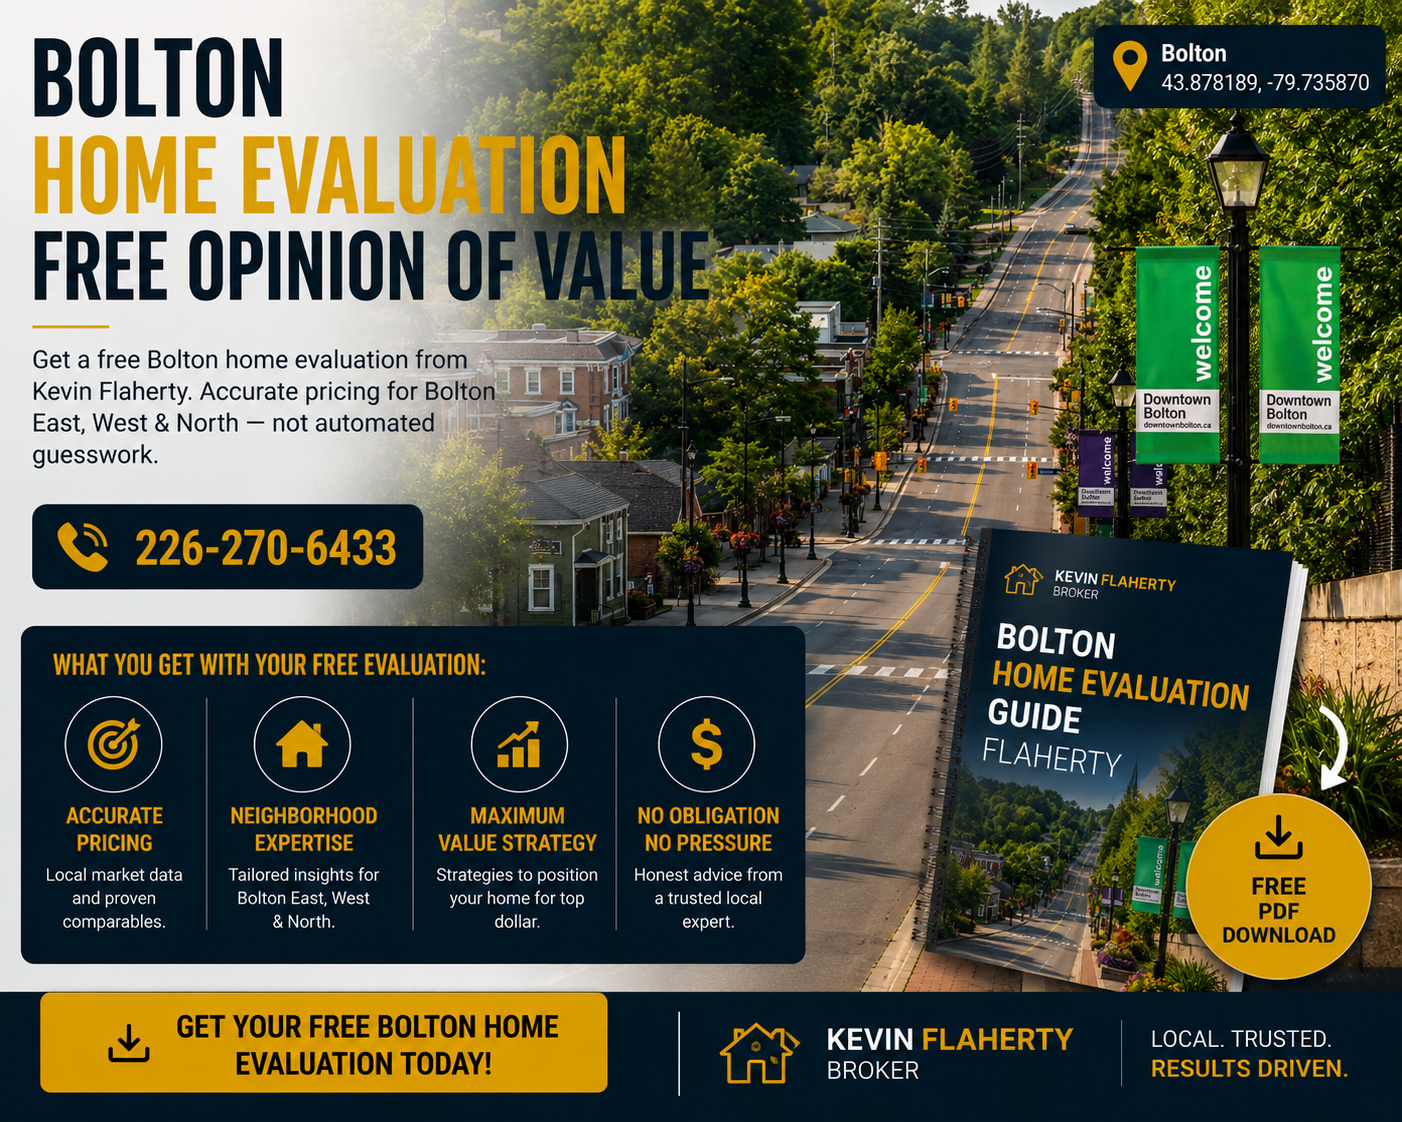
Using Automated Estimate Tools as a Pricing Baseline
Zestimate, HouseSigma AI, and similar tools use algorithm-based valuations that do not account for Bolton's sub-community spread, lot orientation, school catchment boundaries, or the GTA buyer psychology premium. These tools are accurate to within 8–12% in dense urban markets. In Bolton, they are frequently off by 10–18%. Using an automated estimate as your pricing baseline — rather than as a rough sanity check — is one of the most expensive mistakes a Bolton seller can make. A free professional evaluation from a Bolton broker who has sold in every sub-community is a far more reliable starting point.

What Do Bolton Home Sellers Say About Working With the Flaherty Team?
Real reviews from real clients.
"Kevin and his team were professional, calm, and reassuring throughout the entire process. He clearly explained every step and made sure we understood what was happening. His knowledge of the market was evident — we sold quickly and for a price we were very happy with."— Erin Woodley
"From our first sit down with Kevin, his vast experience and knowledge of the market was very evident. He was always available to answer our questions and kept us informed throughout the entire process. We would highly recommend Kevin and his team to anyone looking to buy or sell."— Melissa R.
"Kevin was extremely knowledgeable about the local market and helped us price our home perfectly. We had multiple showings in the first week and accepted an offer above our asking price. His pricing strategy was spot on — we couldn't have asked for a better result."— David & Sandra K.
Watch: Bolton Home Selling Guides
Three essential videos for Bolton homeowners preparing to sell.
Related Bolton Selling Resources
Frequently Asked Questions
The most reliable signal is showing activity in the first 7–10 days. A correctly priced Bolton home generates 8–15 showings in the first week. If you have fewer than 5 showings in the first 10 days, the market is telling you the price is too high. The second signal is the sale-to-list ratio on recent comparable sales — if comparables are selling at 97–99% of asking, your price should be set so that 97–99% of your asking price equals your target net proceeds.
Bolton East detached homes are selling in the $950,000–$1,050,000 range in 2026, depending on size, lot, age, and finish. Semi-detached homes range from $820,000–$900,000. Townhouses range from $720,000–$800,000. These are market ranges, not individual valuations — the correct price for your specific home requires a professional comparable sales analysis. Get a free evaluation here.
No. This strategy consistently produces worse outcomes in Bolton's current market. Homes priced above market sit longer, accumulate DOM stigma, and ultimately sell for less than correctly priced homes. The data is clear: Bolton homes that require a price reduction sell at an average 96.1% sale-to-list ratio versus 99.2% for correctly priced homes. On a $960,000 home, that is a $29,760 difference. Price correctly from day one.
A full kitchen renovation in Bolton typically adds $40,000–$65,000 in market value, depending on the sub-community price ceiling and the quality of the renovation. A $120,000 renovation does not add $120,000 in value — the return on renovation investment in Bolton averages 45–55% for kitchens and 35–50% for bathrooms. The renovation premium is also capped by the sub-community ceiling: a renovated Bolton North home cannot be priced above the Bolton East ceiling regardless of finish quality.
Bolton's current sale-to-list ratio is 97–99% (April 2026 data). This means buyers are negotiating 1–3% below asking price on average. The ratio is higher in Bolton East (98–99%) and slightly lower in Bolton North and West (96–97%). For context, the Bolton sale-to-list ratio was above 100% during the 2021–2022 peak market, meaning buyers were paying over asking. The current ratio reflects a balanced market with a slight buyer advantage.
Bolton detached homes average $960,000 versus $920,000–$950,000 in comparable Brampton areas — a 1–4% Bolton premium. GTA buyers will pay this premium for Bolton's community lifestyle, school quality, lot sizes, and proximity to green space. However, the premium has a ceiling: when Bolton prices push more than 8% above comparable Brampton homes, buyers choose Brampton. The current market is near the top of the premium window, which means pricing precision is especially important in 2026.
Correctly priced Bolton homes sell in 24–28 days on average (April 2026). Bolton East homes sell slightly faster (22–26 days) due to higher buyer demand. Homes that require a price reduction average 55–70 days on market. The first 7–10 days are the most critical — this is when the largest pool of active buyers sees your listing for the first time. A correctly priced home generates the most showing activity in this window and is most likely to receive an offer without a reduction.
Online real estate platforms filter listings by price bands — typically in $25,000 or $50,000 increments. A home listed at $1,001,000 does not appear in searches filtered to "under $1,000,000," which in Bolton is the largest single buyer pool. Pricing at $999,900 instead of $1,001,000 can double your showing traffic in the first week. Strategic pricing points in Bolton include $849,900, $899,900, $949,900, $974,900, $999,900, and $1,049,900.
These tools can be used as a rough sanity check but should never be used as a pricing baseline. Automated valuation models are accurate to within 8–12% in dense urban markets. In Bolton, they are frequently off by 10–18% because they cannot account for sub-community spread, school catchment boundaries, lot orientation, or the GTA buyer psychology premium. A free professional evaluation from a Bolton broker is far more reliable and costs you nothing.
Overpricing triggers a predictable sequence: fewer showings in the critical first 7–10 days, no offers, DOM accumulation, listing stigma (buyers wonder "what's wrong with it?"), a price reduction, and a final sale price below what you would have achieved with correct day-one pricing. Bolton homes that require a price reduction sell at 96.1% of their final asking price — but that final asking price is already lower than the original. The total cost of overpricing on a $960,000 Bolton home averages $29,760–$45,000 when carrying costs are included.
Look for an agent who can show you their personal sale-to-list ratio (not their brokerage's), who can explain the difference between Bolton East, West, and North pricing, and who uses actual sold comparables — not automated estimates — to justify their recommended list price. The Flaherty team achieves a 99.2% sale-to-list ratio in Bolton and Caledon. Book a free consultation here.
Bolton is in a balanced market with a slight buyer advantage in 2026. The sale-to-list ratio of 97–99% and average DOM of 26–35 days indicate that buyers have negotiating power but sellers are not under significant pressure. This is a market where correct pricing is especially important — overpriced homes sit while correctly priced homes sell in under 30 days. It is not the frenzied seller's market of 2021–2022, but well-prepared, correctly priced Bolton homes are still achieving strong results.
The average detached home price in Bolton is approximately $960,000 (April 2026). Bolton East averages $1,008,913. Bolton West averages $880,000–$950,000. Bolton North averages $850,000–$920,000. These are market averages — individual home values depend on size, lot, age, condition, and sub-community. For a precise valuation of your specific home, request a free evaluation here.
School catchment is one of the most significant — and most underestimated — pricing factors in Bolton. Homes in the catchment area of Bolton's top-rated elementary schools command a 3–7% premium over comparable homes outside that catchment. GTA families relocating to Bolton frequently make school catchment their primary search filter, which concentrates buyer demand in specific sub-areas and supports higher prices. This is one reason Bolton East consistently commands higher prices than Bolton North and West.
You can access all Bolton sold prices — the same data your agent uses — through Flaherty.ca/solds. This gives you full MLS sold history for Bolton East, West, and North so you can compare your home to real comparable sales before you price. This is the most important research a Bolton seller can do before their first conversation with an agent.
Ready to Price Your Bolton Home Correctly?
Kevin has sold in every Bolton sub-community for 30+ years. Get a free, accurate pricing opinion — not an automated estimate — based on real sold comparables and current buyer demand.

