What is the average house price in Arthur?
Q2 2026 recorded a $647,962 average and $650,000 median across 13 Arthur sales. These are dated community results, not a current quote for a particular home.







Home / Wellington North Realtors / Market Report
Arthur · Q2 2026 · separate township contextArthur recorded 13 sales in Q2 2026, with a $647,962 average selling price, a $650,000 median, 28 active listings, a 98% reported sale-to-list ratio and 41 average days on market. This is the latest Arthur community release listed by TRREB when checked October 29, 2026. September figures cover Wellington North as a whole: 11 sales, a $527,445 average and 66 average listing days. Neither set of figures is a valuation or deadline for your home.
Average / median: The average divides total reported sale prices by sales. The median is the middle of the ordered prices. Both can change when the mix of homes sold changes.
SP/LP: The reported sale-price-to-list-price ratio. It is not market value or necessarily a comparison with the first asking price.
LDOM / DOM: The monthly report uses listing days on market (LDOM); the community reports use days on market (DOM). These concern sold homes, not the full preparation-to-closing calendar or unsold listings.
Monthly / YTD / quarterly: September is one month; year-to-date (YTD) covers January–September; Q2 covers April–June. Do not add overlapping periods or combine them into a price trend.
Not reported: No sale-based price or timing is shown where there are no sales, or where the quarterly publisher suppresses a small sample. It does not mean a zero-dollar price.
CMA: Comparative market analysis: a real estate professional’s price opinion for a selling decision, not a formal appraisal.
Source: TRREB Wellington Regional Housing Market Report, September 2026, Wellington_202609.pdf, physical PDF page 10. Monthly and YTD figures can be revised in later reports.
TRREB community-report release index lists Q2 2026 as the latest community release checked October 29. Quarterly community results are shown separately below.
Q2 2026 recorded a $647,962 average and $650,000 median across 13 Arthur sales. These are dated community results, not a current quote for a particular home.
From Q1 to Q2 2026, Arthur’s reported average fell from $683,200 to $647,962 while its median rose from $572,000 to $650,000. The sales count changed from five to 13. These measures describe different sets of homes; the movement does not establish that an individual home lost or gained value. Q4 2025 provides another reference point, not a seasonally adjusted trend or a forecast.
Arthur reported 41 average DOM for sold homes in Q2 2026. That is not the whole preparation-to-closing calendar or a selling deadline. Wellington North’s September result of 66 LDOM covers a different geography and period.
Q2 recorded 13 sales, 64 new listings and 28 active listings. This quarterly snapshot does not establish a universal market label or the negotiating position for every home. Review direct competition, relevant sales and actual buyer response.
The reports used here do not identify buyer origins or prove commuter-driven demand. Buyers considering travel should check their own route, schedule and current conditions. Explain the home’s actual location and features rather than assume a fixed buyer profile.
Kevin explains his media and online-showing approach. Discuss the services relevant to your Arthur property; the overview does not establish a market-price change or guarantee a selling result.
On phones, scroll sideways within the table to read every column.
| Measure | Q2 2026 |
|---|---|
| Sales | 13 |
| Dollar volume | $8,423,500 |
| Average selling price | $647,962 |
| Median selling price | $650,000 |
| New listings | 64 |
| Active listings | 28 |
| Reported average SP/LP | 98% |
| Average DOM | 41 |
TRREB Q4 2025 community report, PDF page 2 · TRREB Q1 2026 community report, PDF page 2 · TRREB Q2 2026 community report, PDF page 2
The 13-sale sample describes completed activity in April–June. The 28 active listings are a reporting-period-end count, not live October inventory. The 41 average DOM excludes preparation and closing and does not describe unsold homes. Neither the average nor median sets a price for a particular property.
From Q1 to Q2 2026, Arthur’s reported average fell from $683,200 to $647,962 while its median rose from $572,000 to $650,000. The sales count changed from five to 13. These measures describe different sets of homes; the movement does not establish that an individual home lost or gained value. Q4 2025 provides another reference point, not a seasonally adjusted trend or a forecast.
On phones, scroll sideways within the table to read every column.
| Period | Sales | Average | Median | DOM |
|---|---|---|---|---|
| Q4 2025 | 12 | $625,708 | $611,250 | 59 |
| Q1 2026 | 5 | $683,200 | $572,000 | 40 |
| Q2 2026 | 13 | $647,962 | $650,000 | 41 |
TRREB Q4 2025 community report, PDF page 2 · TRREB Q1 2026 community report, PDF page 2 · TRREB Q2 2026 community report, PDF page 2
On phones, scroll sideways within the table to read every column.
| Measure | Q2 2025 | Q2 2026 |
|---|---|---|
| Sales | 16 | 13 |
| Average price | $652,882 | $647,962 |
| Median price | $634,950 | $650,000 |
| Average DOM | 50 | 41 |
TRREB Q2 2025 community report, PDF page 2 · TRREB Q2 2026 community report, PDF page 2
Arthur’s Q2 average was slightly lower in 2026 than in 2025, while its median was higher. There were 13 sales versus 16, and reported average DOM fell from 50 to 41. Comparing the same calendar quarter provides another reference alongside the sequential quarters, but these are different groups of sold homes. The figures do not establish an individual home’s appreciation or loss, the cause of a change, or a guaranteed selling time.
These are different sets of sold homes in different periods. The comparisons are not seasonally adjusted, do not establish the cause of a change and do not measure an individual property’s appreciation or loss. Quarterly figures can differ from sums of older monthly publications.
On phones, scroll sideways within the table to read every column.
| Property type | Sales | New listings | Avg. price | DOM |
|---|---|---|---|---|
| Detached | 9 | 43 | $672K* | 43 |
| Semi-detached | 2 | 3 | Not reported | Not reported |
| Attached / row / townhouse | 2 | 18 | Not reported | Not reported |
| Condo townhouse | 0 | 0 | Not reported | Not reported |
| Condo apartment | 0 | 0 | Not reported | Not reported |
| Other | 0 | 0 | Not reported | Not reported |
*The detached average and median are both rounded to $672K in the source charts. Suppressed figures are not zero.
Detached homes accounted for nine of Arthur’s 13 Q2 sales. The detached charts show both average and median rounded to $672K, 43 average DOM, 98% SP/LP and a 21% sales-to-new-listings ratio. Two semi-detached and two attached/row/townhouse sales were also reported; their price, ratio and timing measures are suppressed. The publisher does not report some statistics when sales number two or fewer. A suppressed result is unavailable, not zero.
On phones, scroll sideways within the table to read every column.
| Measure | September | January–September |
|---|---|---|
| Sales | 11 | 121 |
| Dollar volume | $5,801,900 | $69,534,570 |
| Average price | $527,445 | $574,666 |
| Median price | $460,000 | $557,000 |
| New listings | 32 | 302 |
| Average SP/LP | 96% | 97% |
| Average LDOM | 66 | 72 |
| Active listings at September month-end | 91 | Not a YTD activity total |
Source: TRREB Wellington Regional Housing Market Report, September 2026, Wellington_202609.pdf, physical PDF page 10. Monthly and YTD figures can be revised in later reports.
September and January–September results cover the entire Township of Wellington North, including Arthur, Mount Forest and rural properties. They are newer township context, not Arthur-only prices or live October inventory. The monthly and year-to-date periods overlap and must not be added together. DOM in the community report and LDOM in the municipal report must retain their source labels.
These are Q2 community results within Wellington North, separate from September township activity and live October inventory.
On phones, scroll sideways within the table to read every column.
| Community | Sales | Average | Median | New | Active | SP/LP | DOM |
|---|---|---|---|---|---|---|---|
| Arthur | 13 | $647,962 | $650,000 | 64 | 28 | 98% | 41 |
| Mount Forest | 36 | $526,144 | $527,500 | 61 | 51 | 97% | 90 |
| Rural Wellington North | 2 | Not reported | Not reported | 18 | 7 | Not reported | Not reported |
TRREB Q4 2025 community report, PDF page 2 · TRREB Q1 2026 community report, PDF page 2 · TRREB Q2 2026 community report, PDF page 2
These Q2 results describe different communities and property mixes within Wellington North. Arthur’s 13 sales and Mount Forest’s 36 sales are not interchangeable comparison sets. Rural Wellington North had two sales, so its price, ratio and DOM figures are not reported. Do not derive hidden rural values from another table or apply a fixed community price difference to a home.
Download the eight-page report for Arthur Q2 results, selected prior quarters, property-type and nearby-community comparisons, separately labelled township context, a reading key and a five-step seller plan. It includes space for comparable evidence and estimated sale costs.

Market averages cannot value an individual home. Use these tools to organize your own evidence and sale assumptions, then review the differences and costs with Kevin and the appropriate advisers.
Enter completed comparable sale prices and verified living areas in square feet. Use the same measurement basis and explain differences in location, property type, condition, land and services. The worksheet calculates the entries you provide; it does not adjust them or estimate your home’s value.
Enter your own price assumption and applicable costs. Brokerage fees are negotiated; confirm the agreed amount and inclusions in writing. Other costs should be entered inclusive of their own taxes. Avoid counting an included service or lender charge twice.
RECO — representation agreements and fees · CRA — GST/HST rates and calculation
Separate Arthur from Mount Forest and rural Wellington North. Compare completed sales and active competition by property type, lot, servicing, condition, layout, improvements and relevant location. Explain why each comparison deserves weight.
Use the dated report to understand the sample, then examine current property-specific evidence. Kevin’s comparative market analysis (CMA) is a price opinion for a selling discussion, not a formal appraisal, lending decision or guaranteed sale price.
Organize available permits, surveys, renovation invoices, equipment contracts and major-system details. Private services, access and outbuildings need property-specific records. Discuss disclosure duties with your lawyer and Realtor; optional inspections do not replace those duties or find every concern.
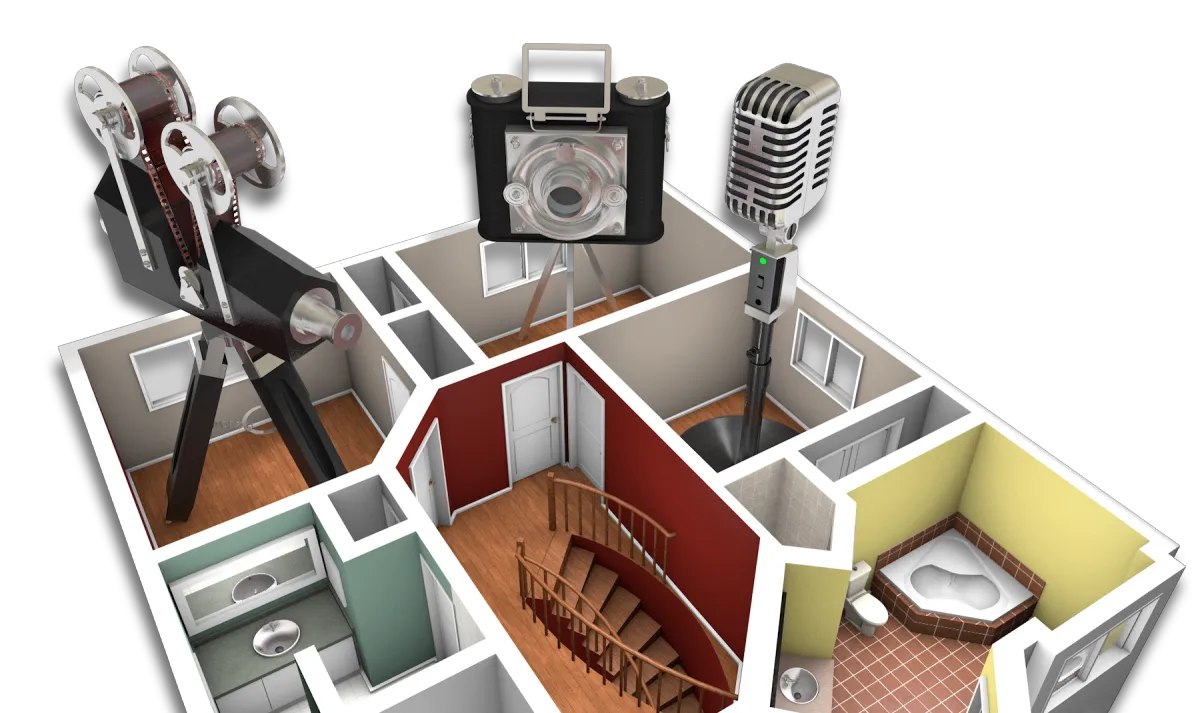
Professional photographs, floor plans, supported property details and Video Narrated VR Animated Online Showings can explain the home and setting before visits. Presentation does not establish financing, eliminate conditions or guarantee an offer. Confirm the service scope in writing.
Review inquiries, access, showings, recurring objections, competing listings and new sales. Reassess the asking position or presentation when the evidence supports it. There is no universal showing count, deadline or price reduction that suits every listing.
RECO: seller disclosure obligations. Ask your lawyer and Realtor which facts require disclosure. Do not conceal concerns or assume an inspection finds everything.
Kevin’s stated sale-to-list ratio
Kevin’s stated selling-time comparison
Kevin’s broader real estate experience
Kevin also states over $500 million in real estate sold and an average $4,358 comparison with average agents. These are his performance statements, not Arthur Q2 statistics. His 99.2% ratio is not market value. Underlying periods, samples and comparison methods are not provided here; these statements are not directly compared with the community results and do not set this home’s price, proceeds or deadline.
His team uses Video Narrated VR Animated Online Showings alongside supported property information and an agreed service plan. Presentation helps explain a property; it does not establish a buyer’s financing or guarantee an offer.
Prepare questions about representation, communication, services and the proposed agreement.
Review asking position, access, reach and actual feedback when a listing is not attracting the expected response.
Prepare questions for your lawyer and Realtor about the actual transaction; this overview is not property-specific legal advice.
Discuss the appropriate inspection scope and any specialist advice for the actual home.
These are individual client experiences across Kevin’s service area, not attributed to Arthur or presented as typical results.
When we decided to sell our home we considered several agencies and agents. The expression 'you only get one chance to make a first impression' rings true in many applications, and none so important as selling your home. The 'first impression' we got from Kevin was that he knew his stuff. He was informed of trends in the housing market and what would sell and what hindered sales. Factors such as recent home sales, value of homes compared to what peoples hearts told them their worth all played into our decision to list with Kevin. His approach was not fast paced and had no high pressure tactics like that of a used car salesman of years gone by. His attitude was genuine and honest. He advised us of what we could do to increase the value of our home and what would make for a realistic sale. His years in the industry and his network of contacts played a key role in our home selling in a very short period of time, and over asking.
Peter Haddrell · RankMyAgent
From our first sit down with Kevin, his vast experience and professionalism were apparent. We interviewed several realtors and went with Kevin and his team because of his unique marketing strategy in this age of technology. Our home was advertised on many platforms. The 3-D virtual walk through the team created was exceptional. Potential buyers got a very accurate depiction of the property and home. Rooms were shown both furnished and unfurnished, and accurate blueprints with detailed room measurements were provided to assist interested shoppers. Kevin and his team answered any questions and requests in a timely manner and provided the sound advice needed to get our property sold for full asking price in a difficult market. What more could you ask for?
Melissa R. · RankMyAgent
Flaherty Team Google profile: 5.0/5 from 61 reviews, checked October 29, 2026. Separately, Kevin Flaherty’s RankMyAgent profile: 4.96/5 from 52 verified reviews, checked October 29, 2026. These are separate profile totals across service areas.
Q2 2026 recorded a $647,962 average and $650,000 median across 13 Arthur sales. These are dated community results, not a current quote for a particular home.
From Q1 to Q2 2026, Arthur’s reported average fell from $683,200 to $647,962 while its median rose from $572,000 to $650,000. The sales count changed from five to 13. These measures describe different sets of homes; the movement does not establish that an individual home lost or gained value. Q4 2025 provides another reference point, not a seasonally adjusted trend or a forecast.
Arthur reported 41 average DOM for sold homes in Q2 2026. That is not the whole preparation-to-closing calendar or a selling deadline. Wellington North’s September result of 66 LDOM covers a different geography and period.
Q2 recorded 13 sales, 64 new listings and 28 active listings. This quarterly snapshot does not establish a universal market label or the negotiating position for every home. Review direct competition, relevant sales and actual buyer response.
Arthur’s Q2 report shows a 98% average SP/LP ratio for reported sales. It does not measure market value, original asking-price performance or a guaranteed discount on any listing. An asking strategy itself affects the ratio.
The Q2 report shows 28 active Arthur listings at the end of its reporting period. This is not a live inventory count for October. Review current competing listings for your property.
Detached homes accounted for nine of Arthur’s 13 Q2 sales. The detached charts show both average and median rounded to $672K, 43 average DOM, 98% SP/LP and a 21% sales-to-new-listings ratio. Two semi-detached and two attached/row/townhouse sales were also reported; their price, ratio and timing measures are suppressed. The publisher does not report some statistics when sales number two or fewer. A suppressed result is unavailable, not zero.
These Q2 results describe different communities and property mixes within Wellington North. Arthur’s 13 sales and Mount Forest’s 36 sales are not interchangeable comparison sets. Rural Wellington North had two sales, so its price, ratio and DOM figures are not reported. Do not derive hidden rural values from another table or apply a fixed community price difference to a home.
The reports used here do not identify buyer origins or prove commuter-driven demand. Buyers considering travel should check their own route, schedule and current conditions. Explain the home’s actual location and features rather than assume a fixed buyer profile.
Use accurate photographs, floor plans, supported information and online showings to explain the property before a visit. Relevant outreach can help people understand the home; it does not guarantee interest, financial qualification or a sale.
Kevin’s seasonal advice should be considered alongside readiness, competing listings, moving plans and the actual property. These quarterly samples do not isolate a seasonal premium or establish that waiting will improve net proceeds.
Arthur had 64 new listings and 13 sales in Q2 2026, about 4.92 new listings per sale. These are quarterly activity totals, not matched cohorts or months of inventory. The simple comparison does not show what happened to each new listing.
The Q2 average was $647,962 and median $650,000 across 13 sales. The average is the arithmetic mean; the median is the middle sale. Their relationship depends on which homes sold and does not alone establish individual price movement.
There is no universal stale-listing threshold. The Q2 average of 41 DOM describes reported sold homes. Compare your listing’s asking position, condition, presentation, access and response with its direct competition.
Kevin recommends an asking strategy grounded in relevant sales and current competition. A higher asking price can affect response, but price is one possible cause among condition, access, presentation and demand. No fixed reduction or search threshold guarantees a result.
Arthur reported no condo-apartment sales or new condo-apartment listings in Q2 2026. That quarter’s lack of activity does not establish that the category is permanently absent or give a price for an individual unit.
Arthur’s Q2 detached charts show both average and median rounded to $672K, based on nine sales. Rounded chart values should not be presented as a precise address valuation.
Choose work based on condition, safety, buyer concerns, budget and likely value to this property. Investigate moisture or defects before cosmetic work. Renovations, paint and staging do not have automatic returns; get appropriate quotes and professional advice.
Kevin states a 99.2% sale-to-list ratio and a 52%-faster selling-time comparison. These are his performance statements, not Arthur Q2 results or measures of market value. Their underlying periods, samples and comparison methods are not supplied here, so they are not directly matched to this municipal/community report.
Arthur’s Q2 2026 dollar volume was $8,423,500 across 13 reported sales. Dollar volume is total reported sales value, not the equity released to homeowners or a measure of an individual home’s value.
Arthur reported two semi-detached sales and three new listings in Q2 2026. Price, ratio and timing figures are not reported for this small sales count. Use relevant property evidence rather than inventing a category average.
These Q2 results describe different communities and property mixes within Wellington North. Arthur’s 13 sales and Mount Forest’s 36 sales are not interchangeable comparison sets. Rural Wellington North had two sales, so its price, ratio and DOM figures are not reported. Do not derive hidden rural values from another table or apply a fixed community price difference to a home.
Staging can clarify room use and presentation, but its usefulness depends on the home and budget. Arthur’s 41-day Q2 average does not prove staging causes faster sales or a higher price. Review condition, evidence, presentation and access together.
Request a property-specific CMA price opinion and discuss the relevant evidence, limitations and current competition. It is not an exact value, formal appraisal or guaranteed selling price. A lender or other decision-maker may require a separate appraisal.

Kevin Flaherty is a Broker with eXp Realty serving south-central Ontario. He states 38 years of broader real estate experience and over $500 million in real estate sold. For Arthur homeowners, his approach connects relevant market evidence with the actual home, land, services, condition and current competition. His team uses Video Narrated VR Animated Online Showings alongside supported property information and an agreed service plan.
The Flaherty Team is listed by the Mount Forest Chamber of Commerce. His office is at 170 Lakeview Court, Unit 3A, Orangeville.
This street map is centred on Arthur, a community within the Township of Wellington North. Use it to explore the town and nearby roads. It does not show a community or property boundary, establish rights of access or identify a Flaherty office.
Arthur street map. Official location and planning references are linked below.
Community location: Natural Resources Canada — Arthur. Basemap © OpenStreetMap contributors.
For the official urban-centre boundary, view Wellington County Official Plan Schedule B6-2 — Arthur (revised December 2025). Confirm site-specific planning information with the Township.
Request a free, no-obligation Arthur evaluation and discuss relevant comparisons, current competition, condition, services, useful preparation and your next move. A report-wide average provides context; your property needs its own evidence.

170 Lakeview Court; Unit 3A
Orangeville, ON
L9W 5J7

Not Intended To Solicit Properties Already Listed For Sale.
A HoneyCombHub.ca Web Site Solution
Copyright 2026 . All rights reserved.