Kevin Flaherty, real estate broker, smiling in a professional suit with a blue tie, representing the Flaherty Team.
Kevin Flaherty, top 1% Orangeville realtor for 10+ years, providing free no-obligation home value opinions — call 226-270-6433
Kevin Flaherty Home Selling System Team branding graphic featuring the text ‘Kevin@Flaherty.ca
’ and toll-free phone number 1-877-352-4378
Graphic with the text ‘Online Showings – Get Your Home Sold Faster & For More!’ promoting Video Narrated VR animated online showings for faster real estate sales
Real estate marketing graphic showing a house with a ‘SOLD!’ sign promoting access to sold listings and property information, with a yellow ‘Click Here’ button offering access similar to a REALTOR.
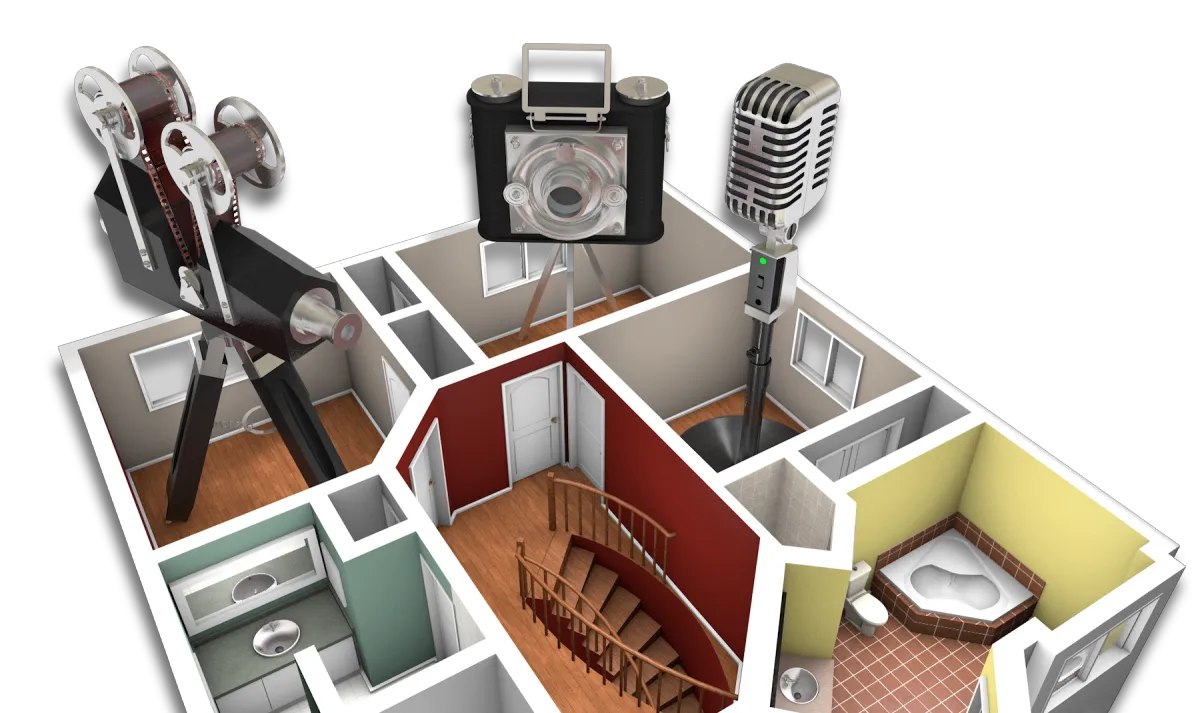
VR floor plan of a home with oversized camera, video camera, and microphone graphics representing high-quality real estate photography, and video narrated VR animated online showings for advanced property marketing.
Flaherty Team logo with Kevin@Flaherty.ca featuring "Flaherty" in bold text, "Home Selling System Team" below, emphasizing real estate services
Graphic with the text ‘Online Showings – Get Your Home Sold Faster & For More!’ promoting Video Narrated VR animated online showings for faster real estate sales
Town of Erin · October 2026 · Separate Q3 community results

Erin Real Estate Market: Prices, Activity and Selling Context

In October 2026, the Town of Erin recorded 11 home sales, all detached, at a $1,095,377 average price and $1,110,000 median. There were 34 new listings and 114 active listings at month-end. The reported sale-to-list ratio was 95%, and sold listings averaged 80 listing days on market. These municipal results are context for a property-specific comparison, not a value or deadline for your home.

Five Questions About the Erin Market

What is the average home price in Erin, Ontario?

The October 2026 municipal average was $1,095,377 across 11 sales. January–October averaged $1,087,239 across 152 sales. Neither is an automatic value for your property; select relevant comparisons and explain the differences.

Is Erin a buyer’s market or seller’s market?

The October snapshot shows 11 sales, 34 new listings, 114 month-end active listings and a 95% reported SP/LP. These describe supply and completed activity. They do not alone establish motivation, the cause of a result or a universal buyer/seller-market classification for every segment.

How many homes are for sale in Erin?

The October 2026 report shows 114 active listings at month-end and 34 new listings during the month. It is a dated count, not the number available today. Review current competing properties before listing.

Are Erin home prices going up or down?

The selected quarterly results vary across changing samples. Q3 2026 averages and medians were below Q3 2025 in both community rows, but that does not establish an individual home’s change. Compare like homes and keep community and municipal figures separate.

How long does it take to sell a house in Erin?

Sold listings averaged 80 LDOM in the October municipal report and 50 LDOM over January–October. Q3 community summaries reported 49 LDOM for Erin and 52 for Rural Erin. Keep scopes and source labels separate. These are not preparation-to-closing schedules or deadlines, and unsold listings are excluded.

Read the Measures Before Comparing

Average and median

The average is total reported sale value divided by sales. The median is the middle sale price. Different groups of homes can move both measures without establishing how an individual home changed value.

SP/LP — sale price / list price

The monthly report defines this as average selling price divided by average listing price for reported firm transactions. It is not an original-asking-price discount, a valuation accuracy score or a predicted negotiation allowance.

LDOM — listing days on market

The monthly report’s average days sold listings were on the market. It excludes homes that did not sell and is not the whole preparation-to-closing calendar.

DOM — days on market

The property-type charts label their timing measure average days on market (DOM). The Q3 2026 all-types community summary labels it LDOM; earlier summaries use DOM. Keep the source, period and geography attached; do not automatically add condition days that may overlap a reported listing period.

YTD — year to date

Here, January through October 2026. It includes October; adding the two periods would double-count October. YTD active listings are not reported.

New and active listings

New listings are entries during the stated period. Active listings are the stock at the period end, not the number available today.

Sales-to-new-listings ratio

Sales divided by new listings describes a same-period calculation, but some source chart labels differ from the displayed counts. Published chart ratios are shown as reported, without silently recalculating them. A ratio is not a probability of sale, a valuation formula or formal months of inventory.

Geography and small samples

Town of Erin monthly totals, quarterly “Erin” / “Rural Erin” community rows, and Wellington Region context cover different scopes. Some quarterly measures for two or fewer sales are not reported; blank figures are not zero.

The report covers Canadian-dollar resale activity reported through the TRREB MLS system for the stated periods. The monthly municipal totals, quarterly community rows and regional context answer different questions. The report is not a forecast, appraisal or automatic home valuation.

October and January–October: Town of Erin

On phones, scroll sideways within the table to read every column.

Town of Erin — October 2026
MeasureReported result
Sales11
Dollar volume$12,049,150
Average price$1,095,377
Median price$1,110,000
New listings34
Month-end active listings114
SP/LP95%
Average LDOM80

On phones, scroll sideways within the table to read every column.

October 2026 — Town of Erin property types
TypeSalesAverageMedianNewActiveSP/LPLDOM
All home types11$1,095,377$1,110,0003411495%80
Detached11$1,095,377$1,110,0003210895%80
Semi-detached0--23--
Attached/row/townhouse0--03--

All 11 October sales were detached. Semi-detached and attached/row/townhouse rows had no sales, so their sale-based values remain unreported; their new and active listings are shown. Other property categories had no sales, new listings or active listings.

On phones, scroll sideways within the table to read every column.

October 2026 — reported dollar volume
TypeDollar volume
All home types$12,049,150
Detached$12,049,150
Semi-detached-
Attached/row/townhouse-

On phones, scroll sideways within the table to read every column.

Town of Erin — January–October 2026
MeasureReported result
Sales152
Dollar volume$165,260,320
Average price$1,087,239
Median price$922,500
New listings513
SP/LP95%
Average LDOM50

On phones, scroll sideways within the table to read every column.

January–October 2026 — Town of Erin property types
TypeSalesAverageMedianNewSP/LPLDOM
All home types152$1,087,239$922,50051395%50
Detached135$1,132,539$974,00045895%51
Semi-detached10$737,000$730,00031101%32
Attached/row/townhouse7$713,929$724,5002499%52

On phones, scroll sideways within the table to read every column.

January–October 2026 — reported dollar volume
TypeDollar volume
All home types$165,260,320
Detached$152,892,820
Semi-detached$7,370,000
Attached/row/townhouse$4,997,500

Source: TRREB Wellington Regional Housing Market Report, October 2026, Wellington_202610.pdf, physical PDF page 4. Figures can be revised in later reports.

The YTD period includes October. Its larger sample does not remove differences in property mix. No YTD active-listing total is reported. The 114 active listings are an October month-end count, not the number available today.

Q3 Community Detail: Erin and Rural Erin

The quarterly publisher labels its rows “Erin” and “Rural Erin.” Keep those labels and scopes rather than rename the entire Erin row as Erin Village. Q3 covers July–September 2026, not live November inventory.

On phones, scroll sideways within the table to read every column.

Q3 2026 — separate community rows
RowSalesAverageMedianNewActiveSP/LPLDOM
Erin26$894,994$860,000724997%49
Rural Erin25$1,301,020$1,150,000777094%52

On phones, scroll sideways within the table to read every column.

Q3 2026 — community property-type detail
SegmentSalesAverage*Median*DOMSales/new
Erin detached18$975K$903K4631%
Erin semi-detached5$730K$730K5733%
Erin attached/row/townhouse3----
Rural Erin detached25$1,301K$1,150K5227%

*Property-type prices are rounded exactly as published; K means thousand Canadian dollars. Sales/new preserves the source chart’s ratio. Some published labels differ from displayed sales divided by new listings and are not silently recalculated. A dash means not reported, not zero.

Source: TRREB Erin Community Housing Market Report, Q3 2026, physical PDF page 2 (community totals) and pages 3–4 (property-type charts). The summary labels timing LDOM; charts say average days on market (DOM). The publisher’s row is “Erin”; it is not renamed here as the whole of Erin Village.

TRREB Q4 2025 Erin report, PDF page 2 · TRREB Q1 2026 Erin report, PDF page 2 · TRREB Q2 2026 Erin report, PDF page 2 · TRREB Q3 2026 Erin report, PDF page 2

Village and Newer Resale Comparisons

Consider actual type, location, layout, condition, services and competing new or resale options. New construction does not automatically set a resale premium; investigate actual pricing, incentives, timing and terms.

Rural, Hobby Farm and Luxury Estate Comparisons

Explain usable land, house condition, services, buildings, permissions, access and realistic alternatives. A higher aggregate rural average does not establish an automatic acreage or barn premium, a buyer profile or a property’s value.

Previous Quarters: Keep Each Community Together

On phones, scroll sideways within the table to read every column.

Erin — selected quarters, all home types
PeriodSalesAverageMedianSP/LPDOM / LDOM*
Q4 20259$1,132,556$943,00098%43
Q1 202615$881,031$882,50097%35
Q2 202633$830,375$800,00099%45
Q3 202626$894,994$860,00097%49

On phones, scroll sideways within the table to read every column.

Rural Erin — selected quarters, all home types
PeriodSalesAverageMedianSP/LPDOM / LDOM*
Q4 20259$1,565,389$1,455,00096%66
Q1 202617$1,379,912$1,250,00096%43
Q2 202627$1,289,056$950,00092%52
Q3 202625$1,301,020$1,150,00094%52

TRREB Q4 2025 Erin report, PDF page 2 · TRREB Q1 2026 Erin report, PDF page 2 · TRREB Q2 2026 Erin report, PDF page 2 · TRREB Q3 2026 Erin report, PDF page 2

The selected quarters retain Q4 2025, Q1 and Q2 2026 and add Q3 2026. In Q3, Erin recorded 26 sales at an $894,994 average and $860,000 median; Rural Erin had 25 at a $1,301,020 average and $1,150,000 median. These are changing samples, not repeat sales of the same homes. They do not establish an individual property’s change, a seasonal premium or a cause. *Earlier summaries label timing DOM; Q3 2026 labels it LDOM.

Q4 2025 covers October–December, Q1 2026 January–March, Q2 2026 April–June, and Q3 2026 July–September. These results are not seasonally adjusted or a repeat-sales index. Earlier summaries label timing DOM; Q3 2026 labels it LDOM. Quarterly figures may differ from sums of older monthly publications. Do not join them to October municipal averages as one continuous community series.

Q3 2025 and Q3 2026: A Year-over-Year View

Compare July–September in each year for the same published community rows. These all-home-type results are separate from the October Town of Erin municipal snapshot. *The 2025 summary labels timing DOM; the Q3 2026 summary labels it LDOM. Retain that distinction when reading the time figures.

On phones, scroll sideways within the table to read every column.

Erin — Q3 2025 and Q3 2026, all home types
PeriodSalesAverageMedianDOM / LDOM*
Q3 202526$1,071,077$1,040,00046
Q3 202626$894,994$860,00049

On phones, scroll sideways within the table to read every column.

Rural Erin — Q3 2025 and Q3 2026, all home types
PeriodSalesAverageMedianDOM / LDOM*
Q3 202523$1,433,609$1,298,00053
Q3 202625$1,301,020$1,150,00052

TRREB Q3 2025 Erin report, PDF page 2 · TRREB Q3 2026 Erin report, PDF page 2

How to Read the Comparison

Both community rows reported lower Q3 average and median prices in 2026. Erin recorded 26 sales in each year; Rural Erin had 23 in 2025 and 25 in 2026. These are different groups of homes. The comparison does not show that every property lost value, identify why prices differed or measure a specific home’s change in value.

Comparing the same quarter adds calendar context but does not make the series seasonally adjusted or remove differences in property mix. Average and median are market summaries, not an appraisal or asking-price formula. Keep these community results separate from monthly municipal data and use relevant sales for your property.

Wellington Region and Nearby Municipalities

On phones, scroll sideways within the table to read every column.

October 2026 — Erin and Wellington Region
MeasureTown of ErinWellington Region
Sales11207
Average price$1,095,377$816,037
Median price$1,110,000$742,500
New listings34522
Active listings1141,149
SP/LP (%)9597
Average LDOM8044

On phones, scroll sideways within the table to read every column.

October 2026 — nearby municipalities
MunicipalitySalesAverageMedianSP/LPLDOM
Erin11$1,095,377$1,110,00095%80
Centre Wellington36$878,025$772,50097%42
Guelph/Eramosa13$884,962$780,00098%32
Guelph114$757,048$715,00097%38

On phones, scroll sideways within the table to read every column.

January–October 2026 — separate broader context
GeographySalesAverage price
Erin152$1,087,239
Centre Wellington386$873,063
Guelph/Eramosa133$1,018,514
Guelph1,259$769,704
Wellington Region2,278$829,177

Source: TRREB Wellington_202610.pdf, October / January–October 2026. Physical PDF page 2: Wellington Region; page 3: Centre Wellington; page 4: Erin; page 5: Guelph; page 6: Guelph/Eramosa. All home types.

These are different geographies and property mixes. Erin’s October average was higher in this set, but the table does not rank every home’s value, identify buyer origins or prove why price or timing differed. Wellington Region context is not an Erin-only valuation.

A Practical Erin Seller Plan

1. Establish the right comparison set

Compare relevant completed sales and current alternatives by location, type, condition, land, services and terms. Explain why a sale deserves weight rather than apply the town-wide average to your address. Kevin’s CMA is a price opinion, not a formal appraisal, lending decision or guaranteed sale price.

2. Prepare the property and its records

Gather available surveys, permits, renovation and mechanical records, utility information and equipment contracts. Rural properties may need well, septic, access, outbuilding and conservation information. Agree suitable investigations; an inspection is not universally mandatory and a bacterial water result does not establish chemical safety or supply. Discuss actual disclosure duties with your lawyer and Realtor.

3. Price for the current choice set

The dated snapshot helps frame the discussion, but review listings competing with you when you launch. Choose an asking strategy supported by relevant evidence and your circumstances; no average, median or list-price ratio supplies a guaranteed price.

4. Explain the property online

Use agreed professional photography, plans, accurate records and Video Narrated VR Animated Online Showings to explain supported features and layout. Presentation does not financially qualify viewers, certify condition or permitted use, or guarantee offers.

5. Review response against a defined plan

Review inquiries, reach, workable access, recurring feedback, offers and competing listings together. Investigate what changed before adjusting price or presentation. No fixed day or showing count automatically requires a reduction; funding, conditions and closing arrangements still matter.

Your Printable Erin Market Report

Use the ten-page report for the same municipal results, community detail, previous-quarter and Q3 year-over-year comparisons, Wellington context and five-step seller plan. Definitions appear before the data tables, with space for your own property questions.

Erin market report artwork showing Kevin Flaherty beside the Erin Village Clock
Select the artwork to open the dated Erin Market Report.

See Kevin’s Marketing Approach and Essential Viewing

Use these videos to prepare questions about representation, pricing, records and presentation. They do not establish an Erin sale result or guarantee a particular outcome.

Pro Real Estate Tips - How to Avoid Legal Mistakes When Selling Your House

Prepare transaction-specific questions for your lawyer and Realtor; this overview does not replace legal advice.

10 Questions to Ask Before You Hire a Realtor (Interview Guide)

Prepare questions about representation, service scope, communication and the agreement.

Pro Real Estate Tips - Why Didn't My House Sell?

Review asking position, presentation, reach, access, feedback and competition when a listing stalls.

Pro Real Estate Tips - Home Inspection

Discuss inspection scope, known condition concerns and suitable investigations. No video establishes that a home will pass an inspection.

Clients Describe Working with Kevin

These are individual client experiences across Kevin’s service area, not attributed to Erin or presented as typical market outcomes.

★★★★★
Kevin's experience and marketing team sold my home over asking price in one day. The house was sold before it even went on MLS. We did not have to go through open houses or multiple viewings. The professional videos his team produces are amazing.

Brian Masulka · Google

★★★★★
When we decided to sell our home we considered several agencies and agents. The expression 'you only get one chance to make a first impression' rings true in many applications, and none so important as selling your home. The 'first impression' we got from Kevin was that he knew his stuff. He was informed of trends in the housing market and what would sell and what hindered sales. Factors such as recent home sales, value of homes compared to what peoples hearts told them their worth all played into our decision to list with Kevin. His approach was not fast paced and had no high pressure tactics like that of a used car salesman of years gone by. His attitude was genuine and honest. He advised us of what we could do to increase the value of our home and what would make for a realistic sale. His years in the industry and his network of contacts played a key role in our home selling in a very short period of time, and over asking.

Peter Haddrell · RankMyAgent

Flaherty Team Google profile: 5.0/5 from 61 reviews, checked October 30, 2026. Separately, Kevin Flaherty’s RankMyAgent profile: 4.95/5 from 53 verified reviews, checked November 16, 2026. Platform totals cover their respective profiles, not Erin-only transactions.

Explore Erin’s Community Settings

Confirm the property’s actual setting and services when choosing comparisons. These profiles provide place context; the market tables retain their published reporting geographies.

About Kevin Flaherty

Kevin Flaherty, Broker with eXp Realty, full-length portrait

Kevin Flaherty, Broker with eXp Realty

Kevin grew up near the Erin/Caledon Townline on Highway 24, and Erin was the closest main town to his rural upbringing. His parents were both real estate brokers with deep roots in the Erin community, and some of Kevin's first transactions as a new Realtor in 1988 were trailers in Stanley Park.

Kevin has worked in real estate since 1988. His family connection and broader experience inform the conversation; current records, relevant sales and direct competition support a property-specific CMA price opinion. His office is at 170 Lakeview Court, Unit 3A, Orangeville.

Frequently Asked Questions About the Erin Real Estate Market

What is happening in the Erin real estate market in 2026?

In October 2026, the Town of Erin recorded 11 home sales, all detached, at a $1,095,377 average price and $1,110,000 median. There were 34 new listings and 114 active listings at month-end. The reported sale-to-list ratio was 95%, and sold listings averaged 80 listing days on market. These municipal results are context for a property-specific comparison, not a value or deadline for your home.

What is the average home price in Erin, Ontario?

The October 2026 municipal average was $1,095,377 across 11 sales. January–October averaged $1,087,239 across 152 sales. Neither is an automatic value for your property; select relevant comparisons and explain the differences.

What was the median home price in Erin in October 2026?

The October 2026 Town of Erin median was $1,110,000, which was $14,623 above the $1,095,377 average. This describes the reported sample of 11 detached sales and does not identify the value of a typical village or rural home.

Is Erin a buyer's market or seller's market in 2026?

The October snapshot shows 11 sales, 34 new listings, 114 month-end active listings and a 95% reported SP/LP. These describe supply and completed activity. They do not alone establish motivation, the cause of a result or a universal buyer/seller-market classification for every segment.

Are Erin home prices going up or down?

The selected quarters retain Q4 2025, Q1 and Q2 2026 and add Q3 2026. In Q3, Erin recorded 26 sales at an $894,994 average and $860,000 median; Rural Erin had 25 at a $1,301,020 average and $1,150,000 median. These are changing samples, not repeat sales of the same homes. They do not establish an individual property’s change, a seasonal premium or a cause. *Earlier summaries label timing DOM; Q3 2026 labels it LDOM. The separate Q3 2025–Q3 2026 comparison shows lower reported averages and medians in both community rows. Erin had 26 sales in each year; Rural Erin had 23 and 25. Different sales mixes do not establish a change in every home’s value.

How long does it take to sell a house in Erin?

Sold listings averaged 80 LDOM in the October municipal report and 50 LDOM over January–October. Q3 community summaries reported 49 LDOM for Erin and 52 for Rural Erin. Keep scopes and source labels separate. These are not preparation-to-closing schedules or deadlines, and unsold listings are excluded.

Why can Erin’s average and median prices differ?

The average uses all reported sale values; the median is the middle sale. Expensive or inexpensive sales and changing property mix can affect them differently. October’s median was $14,623 above its average; that difference does not establish a particular cause or an individual property’s change in value.

How do Erin and Rural Erin differ in the quarterly report?

TRREB’s Q3 community report labels its rows Erin and Rural Erin. They recorded 26 sales at an $894,994 average and 49 LDOM, and 25 sales at a $1,301,020 average and 52 LDOM respectively. Do not automatically rename the whole Erin row as Erin Village or substitute either row for the municipal monthly dataset.

How many homes sold in the Erin community rows in Q3 2026?

Q3 2026 reported 26 sales in Erin and 25 in Rural Erin. Q2 reported 33 and 27; Q1 reported 15 and 17, while Q4 2025 reported nine in each. These are separate community quarters; they should not be blended with October municipal results into one trend or valuation.

How many Town of Erin homes sold in October 2026?

The October municipal report recorded 11 sales, all detached. January–October recorded 152 sales. October is already included in that YTD total.

What does Erin's 95% sale-to-list ratio mean for sellers?

The October report defines SP/LP as average selling price divided by average listing price for reported firm transactions. Its 95% does not mean every home sold under asking, establish an original-list-price discount, or prescribe a 5% reduction for your home.

How does Erin compare with Centre Wellington and Guelph?

In October, Erin’s $1,095,377 average and 80 LDOM can be compared with Centre Wellington’s $878,025 and 42, Guelph/Eramosa’s $884,962 and 32, and Guelph’s $757,048 and 38. Different property mixes, sample sizes and locations prevent these figures becoming direct valuations.

Why can Erin's average price differ from nearby markets?

Different locations, property types, land, services, condition and transaction mixes can produce different aggregate prices. The tables do not isolate which factors caused a difference or establish a constant rural, estate or acreage premium.

Should I price my Erin home based on average price or median price?

Use neither figure alone. Kevin compares relevant sales and current alternatives, considers condition, location, land, services, layout and terms, and explains uncertainty. A CMA is a price opinion rather than a formal appraisal or guaranteed price.

What does the Q3 sales-to-new-listings ratio mean for Erin detached homes?

The Q3 Erin detached chart reports 31% sales to new listings. That published label differs from the displayed 18 sales divided by 61 new listings; it is not recalculated here. It is not the probability a particular listing will sell, formal months of inventory or an automatic pricing rule.

What does the Q3 sales-to-new-listings ratio mean for Rural Erin detached homes?

The Q3 Rural Erin detached chart reports 27% sales to new listings, which differs from the displayed 25 sales divided by 77 new listings. Keep the published statistic separate from a recalculated ratio. It does not establish buyer motivation, a required price cut or sale timing.

Do rural and estate homes take longer to sell in Erin?

The Q3 Rural Erin detached chart reports 52 average days on market, compared with 46 for Erin detached homes. That sample does not prove a permanent rural or estate delay, nor does it isolate inspection or buyer-pool effects. A property’s preparation, agreement conditions and closing arrangements require their own calendar.

How does new construction affect the Erin market?

New construction can be an alternative buyers consider. Compare actual availability, prices, incentives, completion timing, services and terms rather than assume a development creates a premium or fixed demand effect for every resale. Confirm project and property information with the Town and provider.

What buyer groups are active in Erin?

Potential buyers may value village amenities, work access, privacy, land, horses or a different lifestyle. The cited MLS reports do not measure buyer origins or establish a fixed GTA, Guelph or Halton Hills buyer profile. Use actual inquiries and comparable alternatives.

What should Erin sellers do if active listings are high?

Investigate the property’s asking position, competition, presentation, records, reach and workable showing access. Explain supported features and unresolved questions. An active-listing count does not establish the cause of weak response or require an automatic reduction.

How often should Erin market data be refreshed?

Review monthly municipal and quarterly community releases when published. Check the stated period and geography, not only the page update date. This report uses October/January–October 2026 and separate Q3 community evidence; it does not describe live November inventory.

Does the Erin market report apply to Hillsburgh, Ospringe, and Orton?

The municipal report provides Town of Erin context, while the community rows have their own published scopes. A Hillsburgh, Ospringe or Orton-area property still needs relevant sales and address-specific services, location and land information. The municipal map is not a parcel or statistical-community boundary.

Can a strong marketing plan improve results in a more selective market?

Clear, accurate media and records can help viewers understand a property before visiting. Video Narrated VR Animated Online Showings do not financially qualify buyers, replace due diligence or guarantee a price, offer or selling time.

What is the first step before listing an Erin home in this market?

Start with a property-specific evaluation. Bring available property details, improvement records, timing goals and questions about competition or estimated proceeds. Kevin can explain a CMA price opinion; ask the relevant adviser whether your purpose needs a formal appraisal or different valuation date.


Research, Resources and Important Information

Match the source, period and geography to the question. Confirm current property requirements and transaction advice before commitments.

Source: TRREB Wellington Regional Housing Market Report, October 2026, Wellington_202610.pdf, physical PDF page 4. Figures can be revised in later reports.

TRREB Q4 2025 Erin report, PDF page 2 · TRREB Q1 2026 Erin report, PDF page 2 · TRREB Q2 2026 Erin report, PDF page 2 · TRREB Q3 2026 Erin report, PDF page 2

The exact monthly source citation identifies the supplied report. The community release directory is not a substitute source for its municipal figures.

Town of Erin: Municipal Boundary

This is the Town of Erin municipal boundary, including its village and rural areas. It is not just Erin Village and does not define informal neighbourhoods, property boundaries, rights of access or an office location.

Boundary: Ontario municipal boundary data, Land Information Ontario. Contains information licensed under the Open Government Licence – Ontario. Basemap © OpenStreetMap contributors. Confirm current property-specific questions with the Town and suitable advisers.

Connect the Market Evidence to Your Property

Bring your address, available records, improvements, timing and questions about current competition. Agree the next step before choosing a public asking price.

Contact form for home valuation inquiries, featuring a prominent "What's Your Home Worth?" heading and submit button, reflecting Flaherty Real Estate's services for homeowners.

170 Lakeview Court; Unit 3A
Orangeville, ON
L9W 5J7

Logo of eXp Realty Brokerage a real estate agency.

Not Intended To Solicit Properties Already Listed For Sale.

A HoneyCombHub.ca Web Site Solution

Copyright 2026 . All rights reserved.

Terms of Service/Privacy Policy