Kevin Flaherty, real estate broker, smiling in a professional suit with a blue tie, representing the Flaherty Team.
Kevin Flaherty, top 1% Orangeville realtor for 10+ years, providing free no-obligation home value opinions — call 226-270-6433
Kevin Flaherty Home Selling System Team branding graphic featuring the text ‘Kevin@Flaherty.ca
’ and toll-free phone number 1-877-352-4378
Graphic with the text ‘Online Showings – Get Your Home Sold Faster & For More!’ promoting Video Narrated VR animated online showings for faster real estate sales
Real estate marketing graphic showing a house with a ‘SOLD!’ sign promoting access to sold listings and property information, with a yellow ‘Click Here’ button offering access similar to a REALTOR.
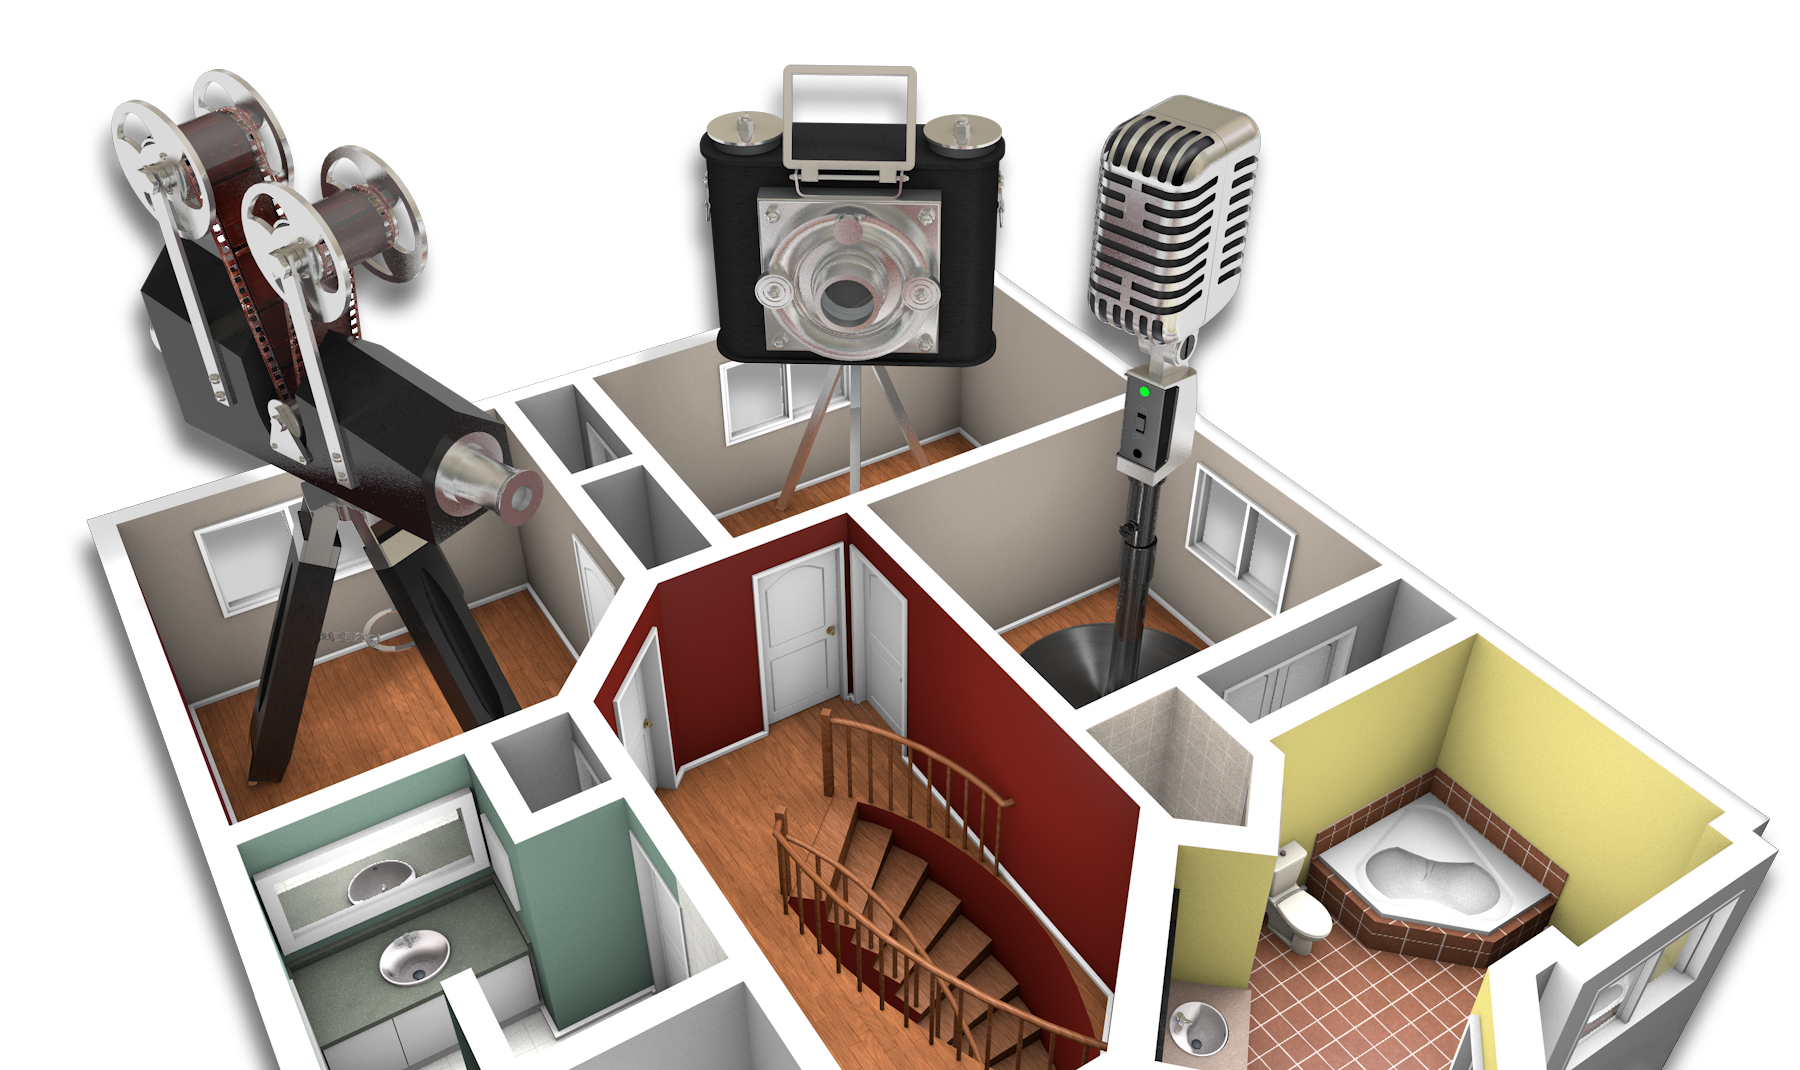
VR floor plan of a home with oversized camera, video camera, and microphone graphics representing high-quality real estate photography, and video narrated VR animated online showings for advanced property marketing.
Flaherty Team logo with Kevin@Flaherty.ca featuring "Flaherty" in bold text, "Home Selling System Team" below, emphasizing real estate services
Graphic with the text ‘Online Showings – Get Your Home Sold Faster & For More!’ promoting Video Narrated VR animated online showings for faster real estate sales
Dufferin County · September 2026

Dufferin County Real Estate Market: Prices and Trends

In September 2026, Dufferin County recorded 61 home sales at an average price of $803,576 and a median of $740,000. There were 216 new listings and 462 active listings at month-end. The reported sale-to-list-price ratio was 96%, and sold listings averaged 40 listing days on market. These county figures provide context; your home needs a comparison based on its municipality, property type, condition, land and current competition.

Know Which Measure You Are Reading

Average and median: The average divides total reported sale value by sales; the median is the middle of the ordered sale prices. Both can change when the mix of homes sold changes.

SP/LP: Sale price to list price. The monthly source defines this as the ratio of average selling price to average listing price for reported firm transactions. It is not market value, an original-asking-price measure or a guaranteed discount.

LDOM and DOM: Listing days on market (LDOM) in the monthly report and days on market (DOM) in community reports describe sold-home listing time. They exclude the full preparation-to-closing calendar and do not describe unsold listings.

Monthly, YTD and quarters: Year-to-date (YTD) here means January–September 2026; Q1 means January–March and Q2 means April–June. Monthly, quarterly and YTD periods overlap. Do not add them together.

HPI: The MLS Home Price Index models a benchmark home for a defined category and area. Its benchmark price and index are different from the average and median of that month’s completed sales.

Not reported: An unavailable value is not zero. Quarterly reports suppress some statistics when there are two or fewer sales; monthly sources may publish small samples that still require caution.

CMA: Comparative market analysis: a real estate professional’s price opinion for a selling discussion, not a formal appraisal or guaranteed result.

TRREB September 2026 Dufferin Regional Housing Market Report, PDF page 2

Four Questions About the Dufferin Market

Is Dufferin County a buyer’s market?

September’s 462 active listings and 61 sales show available supply alongside completed activity. This comparison alone does not establish the negotiating position for every municipality, property type or price range. Review relevant competition and actual response.

What was the average Dufferin County home price?

The September 2026 average was $803,576 and the median $740,000, across 61 reported sales. The county-wide figures are dated context, not a valuation of one home.

How long were Dufferin County homes taking to sell?

Sold listings averaged 40 LDOM in September 2026. Preparation, conditions and closing are separate milestones and can overlap; do not automatically add condition days to the reported listing period.

What should sellers do first?

Start with current relevant sales, direct competition and property records. Discuss the asking strategy, useful preparation, service scope and timing before choosing a launch date.

County Results, with the Broader Period Beside Them

On smaller screens, scroll sideways within the table to read every column.

Dufferin County — September and January–September 2026
MeasureSeptemberJanuary–September
Sales61537
Dollar volume$49,018,126$452,484,965
Average price$803,576$842,616
Median price$740,000$740,000
New listings2161,732
Active listings at September month-end462Not a YTD activity total
Reported SP/LP96%96%
Average LDOM4048

TRREB September 2026 Dufferin Regional Housing Market Report, PDF page 2

The September average exceeded the median by $63,576. That difference reflects the prices in the sold-home sample; it does not by itself identify the cause or measure a particular property’s value. The 462 active listings compared with 61 sales equal about 7.6 active listings per sale. This is a simple month-end-stock-to-monthly-sales comparison, not a formal months-of-inventory calculation or a uniform market label.

Eight Municipalities, Different Samples

On smaller screens, scroll sideways within the table to read every column.

Dufferin municipalities — September 2026, all home types
MunicipalitySalesAverageMedianNewActiveSP/LPLDOM
Amaranth2$743,000$743,000224293%56
East Garafraxa2$1,017,750$1,017,75081899%24
East Luther Grand Valley2$1,244,500$1,244,500184391%70
Melancthon1$692,500$692,500153096%96
Mono5$1,064,000$950,000267194%77
Mulmur4$1,031,750$971,000194196%57
Orangeville33$746,322$740,0007914097%29
Shelburne12$686,624$705,750297798%40

TRREB September report: municipal pages 3–10

Orangeville supplied 33 of the county’s 61 September sales and Shelburne 12. The other municipalities had one to five sales each. Do not treat a small rural sample as a stable pricing or timing rule.

TRREB’s monthly label East Luther Grand Valley describes the municipal row. The county map uses the current Town of Grand Valley name; quarterly Grand Valley and Rural East Luther Grand Valley results remain separate below.

Compare the Right Property Type

On smaller screens, scroll sideways within the table to read every column.

Dufferin County — September 2026 property types
TypeSalesAverageMedianNewActiveSP/LPLDOM
Detached45$878,509$820,00017138296%40
Semi-detached5$637,447$653,000142297%41
Attached / row / townhouse7$653,141$660,000163198%42
Condo townhouse2$564,500$564,50061397%33
Condo apartment2$298,500$298,50071296%45
Link0Not reportedNot reported22Not reportedNot reported

TRREB September 2026 Dufferin Regional Housing Market Report, PDF page 2

Detached homes accounted for 45 of September’s 61 sales. Monthly two-sale condominium results are published, but their small samples can move sharply. Link homes had no sales, two new listings and two active listings. Other reported categories had no sales, new listings or active listings.

January–September detached context: 400 sales, $931,383 average, $803,500 median, 1,351 new listings, 96% SP/LP and 50 average LDOM. These overlapping YTD figures are not additional sales to add to September.

What Earlier Periods Add

On smaller screens, scroll sideways within the table to read every column.

Dufferin County — selected 2026 monthly source editions
MonthSalesAverageMedianNewActiveLDOM
July85$841,635$739,00020448443
August62$831,398$757,37816145849
September61$803,576$740,00021646240

Sources: TRREB Dufferin Regional Housing Market Reports, Dufferin_202607.pdf, Dufferin_202608.pdf and Dufferin_202609.pdf, physical PDF page 2 in each source edition.

Across these source editions, the county average was lower in September than in July and August, while the September median was close to July’s. Sales counts and the homes sold also changed. This is a historical comparison, not evidence that every property lost value or a prediction of the next month. Prior monthly and year-to-date figures can be revised in later publications; these rows retain the values in their named source editions.

September, One Year Apart

On smaller screens, scroll sideways within the table to read every column.

Dufferin County — September 2025 and September 2026, all home types
MeasureSeptember 2025September 2026Change
Sales7761−16 (−20.8%)
Average price$900,132$803,576−$96,556 (−10.7%)
Median price$797,000$740,000−$57,000 (−7.2%)
New listings220216−4 (−1.8%)
Active listings at month-end477462−15 (−3.1%)
Reported SP/LP96%96%0 percentage points
Average LDOM42 days40 days−2 days

Sources: TRREB Dufferin Regional Housing Market Reports, Dufferin_202509.pdf and Dufferin_202609.pdf, physical PDF page 2 in each source edition.

September 2026 recorded 16 fewer county sales than September 2025 (61 versus 77). The reported average price was 10.7% lower and the median 7.2% lower. Active listings were 3.1% lower, while sold listings averaged 40 listing days on market versus 42. These are different sets of sold homes: the comparison does not establish that an individual property lost the same percentage, explain the cause of the change or predict the next sale. Listing days exclude the full preparation-to-closing calendar.

This same-month comparison uses the county All Home Types rows in the named September source editions, not year-to-date totals. Prior figures may be revised in later reports. Percentage changes use September 2025 as the base and are rounded to one decimal; SP/LP changes use percentage points and LDOM changes use days. Average/median changes and the separate annual HPI change measure different things.

On smaller screens, scroll sideways within the table to read every column.

Orangeville — selected community quarters
PeriodSalesAverageMedianDOM
Q1 202656$751,783$719,00055
Q2 2026116$752,605$724,00037

TRREB Orangeville Q1 2026 community report, PDF page 2 · TRREB Orangeville Q2 2026 community report, PDF page 2

On smaller screens, scroll sideways within the table to read every column.

Shelburne — selected community quarters
PeriodSalesAverageMedianDOM
Q1 202622$647,109$640,00059
Q2 202632$660,294$652,50038

TRREB Shelburne Q1 2026 community report, PDF page 2 · TRREB Shelburne Q2 2026 community report, PDF page 2

The Q1 and Q2 reports show different sets of sold homes, with larger Q2 sales counts in Orangeville and Shelburne. These are community quarters, not September municipal results. They are not seasonally adjusted and do not isolate seasonal effects or an individual home’s appreciation. Do not average community medians or combine DOM and LDOM to invent a county result.

Q2 Community Context

Q2 covers April–June 2026. It is separate from September and January–September county/municipal activity. The public release index listed Q2 as the latest community reports when checked October 29.

On smaller screens, scroll sideways within the table to read every column.

Q2 2026 community reports — all home types
CommunitySalesAverageMedianNewActiveSP/LPDOM
Rural Amaranth9$1,259,167$1,145,000563194%76
Rural East Garafraxa7$1,074,429$985,000241897%83
Grand Valley12$620,375$626,250151497%61
Rural East Luther Grand Valley2Not reportedNot reported3816Not reportedNot reported
Rural Melancthon5$784,100$660,000302194%110
Rural Mono15$1,276,469$1,170,0391005296%43
Rural Mulmur13$1,392,692$1,350,000362891%88
Orangeville116$752,605$724,00028314397%37
Shelburne32$660,294$652,5001357497%38

Use the publisher’s exact community names. Grand Valley and Rural East Luther Grand Valley are separate quarterly rows; the September municipal table uses the broader legacy label East Luther Grand Valley. The rural Q2 row has two sales, so its price, ratio and timing measures remain Not reported. These quarter-end listing counts are not live October inventory.

HPI: Benchmark Homes, Not This Month’s Average Sale

On smaller screens, scroll sideways within the table to read every column.

September 2026 HPI — Dufferin County row in the public tables
CategoryIndexBenchmarkYear-over-year
Composite348.8$715,700−2.60%
Single Family Detached355.8$857,200−1.25%
Single Family Attached370.5$659,900−2.55%
Townhouse350.2$479,800−8.97%
Apartment279.2$380,000−11.87%

TRREB September 2026 HPI public tables, physical PDF page 2

On smaller screens, scroll sideways within the table to read every column.

September 2026 Composite HPI — published Dufferin zone
BenchmarkIndex1 mo.3 mo.6 mo.1 yr.3 yr.5 yr.10 yr.
$715,700348.8+1.19%+0.23%−1.61%−2.60%−9.33%−9.12%+69.98%

Multi-horizon source: TRREB MLS HPI Benchmark Summary Report, September 2026, TRREB_MLS_HPI_Benchmark_Summary_Report_0926.pdf, physical PDF page 97, Zone: Dufferin, Composite. The public tables confirm the benchmark, index and annual change.

The public September tables show a Dufferin County Composite benchmark of $715,700, down 2.60% over one year. The detailed summary labels it Zone: Dufferin and reports the same Composite values for Orangeville. Use the published area/category labels; do not treat this as an appraisal of a rural acreage, farm or estate home. The Composite’s +1.19% one-month change and −2.60% one-year change refer to different horizons and can both be true.

The index number is not a dollar price. HPI categories are model definitions and should not be substituted for the monthly property-type averages or a property-specific appraisal.

Your Dufferin County Market Report

Download the nine-page report for the September and year-to-date county snapshot, property types, eight municipalities, the September 2025/2026 comparison, recent months, selected prior quarters, Q2 community context, HPI and the four-step seller plan.

Dufferin County market report artwork with an illustrative county silhouette, charts and modern home
Select the unchanged report artwork to open the dated PDF.

Use the Evidence to Plan Your Sale

Phase 1: Read the market before choosing your selling strategy

  1. Compare active listings and sales as context for available supply; do not call a simple ratio formal months of inventory.
  2. Separate sold-listing time from preparation, conditions and closing when planning the calendar.
  3. Read the reported sale-to-list ratio without assuming a fixed discount or original-asking-price result.
  4. Separate county context from the property’s municipality, type, condition, land, services and competition.
  5. Discuss whether preparation, timing, pricing or presentation is the immediate priority for this property.
  6. Review new listings alongside direct competition rather than assume all county listings compete with your home.
  7. Define the relevant price band and inspect the actual alternatives buyers can consider.
  8. Review relevant completed sales and their asking strategies; ratios alone do not establish value.
  9. Compare average and median movements with sales counts and property mix.
  10. Consider Kevin’s seasonal advice alongside readiness and the evidence; these summaries do not prove a seasonal premium.

Phase 2: Translate the data into a pricing and preparation position

  1. Weigh relevant completed sales and current direct competition together, explaining their differences.
  2. Investigate how land, privacy, renovations, services, outbuildings, views and location affect relevant comparisons; avoid automatic premiums.
  3. Address presentation or condition concerns where useful, safe and suitable; investigate underlying defects before cosmetic work.
  4. Gather available surveys, service records, utility information, permits and improvement receipts.
  5. Build a defensible asking strategy from evidence; a CMA is a price opinion, not an appraisal or guaranteed sale price.
  6. Review private-system and outbuilding records with appropriate professionals; inspections and tests depend on the property and transaction.
  7. Review curb appeal and safe access from the road without assuming a fixed rural buyer profile.
  8. Have the appropriate professionals assess boundaries, easements and access rights; maps and drone images are not legal surveys.
  9. Explain supported features that distinguish this home without implying unverified uses or permissions.
  10. Discuss the evidence with Kevin, drawing on his stated 38 years of broader south-central Ontario experience.

Phase 3: Build the evidence package before launch

  1. Arrange professional photographs, appropriate drone context, floor plans and supported feature explanations.
  2. Use a Video Narrated VR Animated Online Showing to explain layout and features; presentation does not financially qualify buyers.
  3. Confirm the agreed property-website scope, supported documents and permission to share them.
  4. Link the relevant Dufferin community information and verify property-specific location details.
  5. Prepare accurate answers to likely questions; obtain legal, tax or technical advice where appropriate.
  6. Consider useful seasonal imagery when available and lawful; confirm drone permissions, privacy and operating requirements.
  7. Describe supported setting and lifestyle features; verify trail rights and access rather than imply permission.
  8. Discuss Kevin’s stated 57+ online locations and current relevant distribution; an outlet count does not guarantee reach or a sale.
  9. Check that photographs, documents, website and video can be used on phones as well as desktop screens.
  10. Agree on suitable online outreach without assuming a fixed buyer origin or demographic.

Phase 4: Launch, measure and adjust with discipline

  1. Launch when the agreed price, presentation, records and distribution are ready for this property.
  2. Agree on a review schedule for inquiries, access, showings and feedback; the first two weeks are not a universal deadline.
  3. Recheck current competing listings as the choice set changes.
  4. Investigate price, reach, clarity, access, condition and demand before assuming one cause of weak response.
  5. Use relevant evidence when discussing offers; no presentation package guarantees negotiating strength.
  6. Review visits, views and inquiries as engagement signals, not proof of funding or an offer.
  7. Consider price, conditions, financing/appraisal risk, deposit terms and closing arrangements together with professional advice.
  8. Review early lessons when useful rather than apply an automatic 14-day price cut or stale-listing threshold.
  9. Document changes in feedback and evidence before choosing any adjustment.
  10. Discuss the options with Kevin and the appropriate advisers; outcomes depend on the actual property and transaction.

Explain the Property Behind the Price

A county-wide report cannot explain the exact home. Kevin’s service approach brings together relevant evidence, supported property information, professional presentation and agreed outreach. Confirm which photography, drone work, floor plans, online showing, website, documents and distribution are included for your listing.

Kevin states 38 years of broader south-central Ontario real estate experience and distribution to 57+ online locations. Ask about the current relevant outlets, activity and service scope. These statements do not establish a guaranteed price, selling deadline or buyer’s financial qualification.

Five Videos for Your Selling Decisions

How to Sell Your House for Top Dollar | Kevin Flaherty's Marketing Plan

Kevin explains his media and online-showing approach. Confirm the relevant services for your Dufferin property; this overview does not establish a local market-price change or guarantee a result.

Kevin Flaherty 3D Animated Online Showing Sample

A sample of Kevin’s online-showing format. It illustrates presentation, not current Dufferin market evidence or a guaranteed selling result.

10 Questions to Ask Before You Hire a Realtor (Interview Guide)

Prepare questions about representation, communication, services and the proposed agreement.

Pro Real Estate Tips - How to Avoid Legal Mistakes When Selling Your House

Prepare questions for your lawyer and Realtor about the actual transaction; this overview is not property-specific legal advice.

Pro Real Estate Tips - Why Didn't My House Sell?

Review asking position, access, reach and actual feedback when a listing is not attracting the expected response.

Dufferin County Clients Describe Their Experience

These approved reviews describe individual experiences, not typical results, price forecasts or promised selling timelines.

★★★★★

Kevin's experience and marketing team sold my home over asking price in one day. The house was sold before it even went on MLS. We did not have to go through open houses or multiple viewings. The professional videos his team produces are amazing.

Brian Masulka · Google

★★★★★

I couldn't believe how fast my home sold at a time when other homes were sitting on the market. Kevin got mine sold quickly and at a price that was top dollar and even more than I expected. His video narrated VR animated online showing gave my home amazing exposure and reduced unnecessary showings. Kevin was a pleasure to deal with. He was always patient and kept me informed every step of the way. I highly recommend his innovative approach.

Joanne Holding · Google

Flaherty Team Google profile: 5.0/5 from 61 reviews, checked October 29, 2026. Separately, Kevin Flaherty’s RankMyAgent profile: 4.96/5 from 52 verified reviews, checked October 29, 2026. These are separate profile totals across service areas.

Read more Flaherty reviews · View sold-property examples

Explore Dufferin County Communities

Use the relevant community profile for setting and local context, then review the actual property and current evidence. The map below also includes Melancthon and all eight municipal areas.

Melancthon municipal information

Dufferin County Market Questions

What does the September 2026 Dufferin County real estate market data mean for sellers?

In September 2026, Dufferin County recorded 61 home sales at an average price of $803,576 and a median of $740,000. There were 216 new listings and 462 active listings at month-end. The reported sale-to-list-price ratio was 96%, and sold listings averaged 40 listing days on market. These county figures provide context; your home needs a comparison based on its municipality, property type, condition, land and current competition.

Is Dufferin County in a buyer's market in September 2026?

September’s 462 active listings and 61 sales show available supply alongside completed activity. This comparison alone does not establish the negotiating position for every municipality, property type or price range. Review relevant competition and actual response.

What was the average home price in Dufferin County in September 2026?

The September 2026 average was $803,576 and the median $740,000, across 61 reported sales. The county-wide figures are dated context, not a valuation of one home.

How long did it take to sell a Dufferin County home in September 2026?

Sold listings averaged 40 LDOM in September 2026. Preparation, conditions and closing are separate milestones and can overlap; do not automatically add condition days to the reported listing period.

What does a 96% sale-to-list-price ratio mean?

The September source reports a 96% ratio of average selling price to average listing price for firm transactions in its reporting period. It is not market value or a guaranteed 4% discount, and does not show performance against the first asking price.

Why is marketing quality important when active listings are high?

Clear visuals, supported details and accessible records can help people understand the home and decide whether to visit. They do not financially qualify a buyer or guarantee a faster sale, stronger offer or particular price.

Are Dufferin County homes still holding value?

Across these source editions, the county average was lower in September than in July and August, while the September median was close to July’s. Sales counts and the homes sold also changed. This is a historical comparison, not evidence that every property lost value or a prediction of the next month. Prior monthly and year-to-date figures can be revised in later publications; these rows retain the values in their named source editions. The same-month county comparison also shows 61 sales in September 2026 versus 77 in September 2025, with the reported average 10.7% lower and median 7.2% lower. These aggregate comparisons use different sets of homes and do not establish an individual property’s price change. The separate HPI annual change measures a modelled benchmark, not the average or median sale.

How did Dufferin County municipalities compare in September 2026?

September Orangeville recorded 33 sales at a $746,322 average, Shelburne 12 at $686,624, Mono five at $1,064,000 and Mulmur four at $1,031,750. Other municipal samples had one or two sales. Use the full table and direct comparisons; small samples are sensitive to property mix.

What was the MLS HPI benchmark for the Dufferin area in September 2026?

The public September tables show a Dufferin County Composite benchmark of $715,700, down 2.60% over one year. The detailed summary labels it Zone: Dufferin and reports the same Composite values for Orangeville. Use the published area/category labels; do not treat this as an appraisal of a rural acreage, farm or estate home. The Composite’s +1.19% one-month change and −2.60% one-year change refer to different horizons and can both be true.

How should a seller use this market report before listing?

Start with current relevant sales, direct competition and property records. Discuss the asking strategy, useful preparation, service scope and timing before choosing a launch date.

Should I price high and leave room to negotiate?

Discuss an evidence-based asking strategy. An unsupported price may affect response, but condition, access, presentation, reach and demand also matter. No fixed pricing rule guarantees an offer.

What should sellers prepare before using this data for pricing?

Gather available permits, improvement invoices, measurements, surveys, equipment contracts, utility and major-system information, plus private-service and access records where relevant. Confirm rights, lawful uses and what may be shared.

Does this data apply to acreage and hobby farms?

The figures provide context, but acreage and hobby farms need relevant evidence about land, buildings, services, access, permissions and condition. A county average is not an automatic adjustment for those features.

Does this data apply to homes with septic and well systems?

Review actual well and septic records and applicable requirements. A bacterial water result does not establish chemical safety, water supply or septic capacity. Discuss the scope of any optional investigation with qualified professionals and the actual buyer/lender requirements.

Which Dufferin County communities are most affected by market selectivity?

Conditions differ within each municipality and property segment. Review the September municipal table and relevant direct competition rather than rank places by assumed buyer selectivity.

Can strong marketing overcome a weak market?

Marketing cannot change overall demand or guarantee an outcome. Accurate presentation can explain relevant features; price, condition, access, records and competing choices still affect the result.

Why include Video Narrated VR Animated Online Showings on this page?

The videos demonstrate presentation and seller decision topics. An online showing can explain a home before a visit, but it is not a substitute for inspection, professional advice or financial qualification.

How often is this Dufferin County market report updated?

This version was prepared October 29, 2026, using September and January–September county/municipal results, September HPI and separate Q2 community reports. Historical monthly and Q1 comparisons keep their own date labels.

What is an important number for Dufferin County sellers to watch?

September had 462 active listings and 61 sales, about 7.6 active listings per sale. Treat that as a simple comparison, not formal months of inventory. Relevant competition, sales counts, property mix and actual response matter too.

Should I wait for the market to improve before selling?

Compare your goals, timing, carrying costs, next purchase and current alternatives. Any future price is uncertain; mortgage principal repayment differs from an expense. A forecast is not a guaranteed benefit from waiting.

What if my Dufferin County home already failed to sell?

Review asking position, presentation, reach, access, condition, feedback and competition. Confirm the existing brokerage agreement, expiry/cancellation and possible holdover obligations before a relaunch or brokerage change.

Where should I start if I want a property-specific value opinion?

Request a property-specific CMA price opinion using relevant sales and current competition. Confirm its purpose, scope and limits. It is not a formal appraisal, exact value or guaranteed selling result.

What is Kevin Flaherty's local connection to Dufferin County?

Kevin is a Broker with eXp Realty serving Dufferin County and south-central Ontario. His office is at 170 Lakeview Court, Unit 3A, Orangeville. He states 38 years of broader real estate experience; confirm the service scope for your property.

How do average price, median price and HPI differ?

Average and median describe the homes sold in a stated period; they change with the sold-home mix. HPI models a benchmark home for a named area and category. None is an address-specific appraisal, and they should not be substituted for one another.


About Kevin Flaherty

Kevin Flaherty, Broker with eXp Realty

Kevin Flaherty, Broker with eXp Realty

Kevin serves Dufferin County and south-central Ontario with the Flaherty.ca Home Selling System Team. He states 38 years of broader real estate experience. His approach combines relevant market evidence with the actual home, land, services, records and current competition.

The Flaherty Team’s Dufferin Board of Trade profile. His office is at 170 Lakeview Court, Unit 3A, Orangeville.

226-270-6433 · [email protected]

Research, Resources and Important Information

Use each report only for its named period, area and measurement. County monthly and YTD data come from physical page 2; municipal rows from pages 3–10. HPI and community reports are separate sources. July/August source editions and the detailed HPI summary are identified beside their tables.

For legal, tax, financial, inspection or property-permission questions, seek advice about the actual transaction. A report average, benchmark, online showing or orientation map does not replace that advice.

Dufferin County and Its Eight Municipalities

Explore the county outline and its eight municipal areas. Choose a name to zoom in and see its September market context. The boundaries are orientation maps, not property surveys, proof of access or office locations.

The county contains Amaranth, East Garafraxa, Grand Valley, Melancthon, Mono, Mulmur, Orangeville and Shelburne. Official mapping sources and community links are below.

Dufferin County: 61 sales; $803,576 average; $740,000 median; 40 average LDOM. September 2026, all home types.

Market figures: TRREB September 2026 Dufferin report, county page 2 and municipal pages 3–10. Small municipal samples can be volatile; these dated results are context, not home valuations.

Boundaries: Ontario municipal boundary data, Land Information Ontario. Contains information licensed under the Open Government Licence – Ontario. Basemap © OpenStreetMap contributors. Confirm current site-specific information with the municipality and Dufferin County’s mapping service. TRREB uses the legacy municipal name East Luther Grand Valley in its monthly table.

Put the County Figures in Context for Your Home

Request a free, no-obligation evaluation and discuss relevant comparisons, current competition, preparation, records and timing. Kevin’s CMA is a price opinion for your selling discussion, not a guaranteed result.

Contact form for home valuation inquiries, featuring a prominent "What's Your Home Worth?" heading and submit button, reflecting Flaherty Real Estate's services for homeowners.

170 Lakeview Court; Unit 3A
Orangeville, ON
L9W 5J7

Logo of eXp Realty Brokerage a real estate agency.

Not Intended To Solicit Properties Already Listed For Sale.

A HoneyCombHub.ca Web Site Solution

Copyright 2026 . All rights reserved.

Terms of Service/Privacy Policy