






Mount Forest Real Estate Market Report
Mount Forest Q1 2026 home prices, sales and days on market, with July 2026 Wellington North data and January-to-July regional context.
Answer first: the latest Mount Forest-specific TRREB report is Q1 2026, when 16 properties sold for an average of $556,375 and a median of $572,500, with 57 average days on market and a 97% sale-to-list-price ratio. The newer July 2026 report is published for Wellington North as a whole: 19 properties sold for an average of $536,126 and a median of $520,000, with 52 listing days on market and a 96% sale-to-list-price ratio.
Those figures describe two different geographies and reporting periods. The Q1 figures below are the best available local snapshot for Mount Forest; the July figures provide newer township-wide context and should not be represented as Mount Forest-only results. With 38 years of experience and over $500M in real estate sold across south-central Ontario, I use both datasets alongside recent property-level comparables when advising a seller.
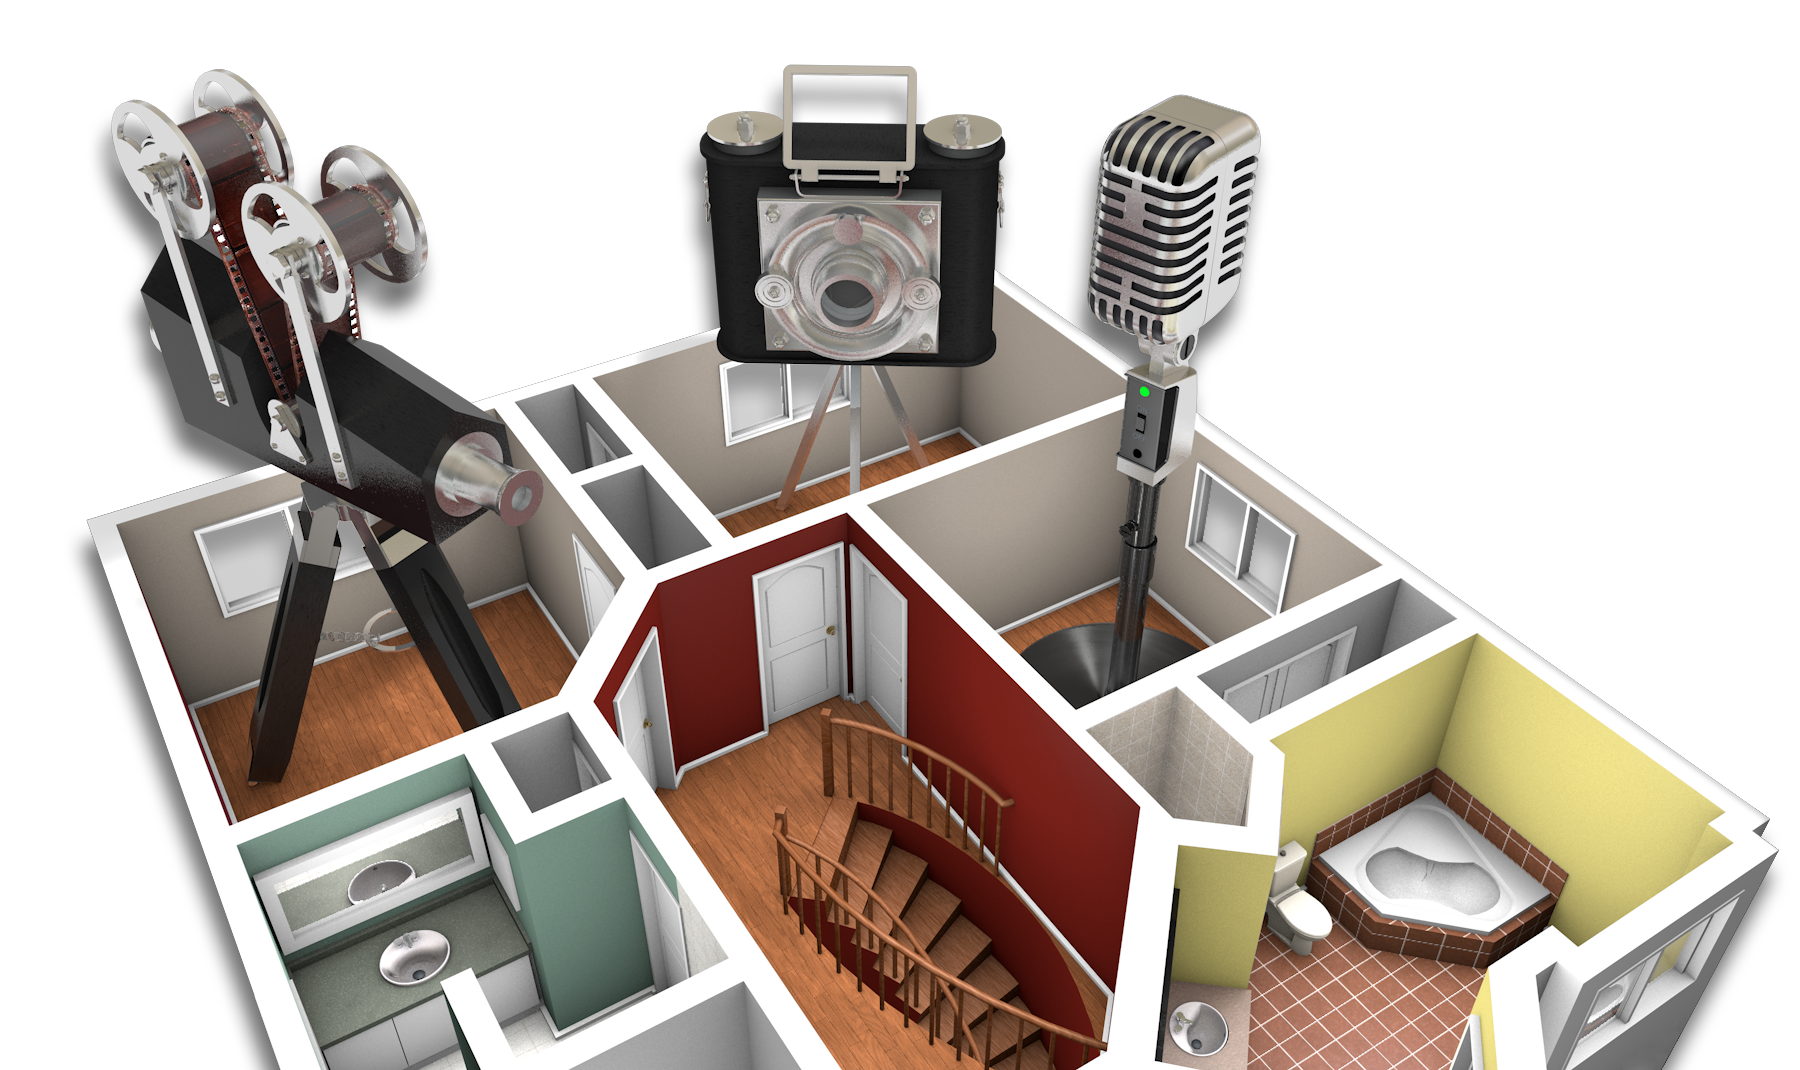
This report separates the two datasets, then explains prices, marketing time, inventory and property-type activity without blending Mount Forest and Wellington North statistics. When combined with our proprietary Video Narrated VR Animated Online Showings, the data provides a more reliable foundation for positioning a home in today's market.
People Also Ask About the Mount Forest Market
What is the average house price in Mount Forest?
The latest Mount Forest-specific report is Q1 2026: the average selling price was $556,375 and the median was $572,500. In the newer July 2026 Wellington North report, the average across all home types was $536,126 and the median was $520,000.
Are house prices dropping in Mount Forest?
The available reports do not support a simple yes-or-no answer. Mount Forest's Q1 average was 1.2% below Q1 2025 while its median was 9.9% higher. July's newer Wellington North figures cover a broader area, so they should not be treated as a direct Mount Forest trend line.
How long does it take to sell a house in Mount Forest?
Mount Forest properties averaged 57 days on market in Q1 2026. The newer July 2026 Wellington North report recorded 52 listing days on market across all home types. These are different measures for different periods and geographies.
Is it a buyer's or seller's market in Wellington North?
July 2026 Wellington North recorded 90 active listings, 26 new listings, 19 sales and a 96% sale-to-list-price ratio. That is about 4.7 active listings for each July sale—a comparison ratio, not formal months of inventory—so a property-specific strategy should rely on direct comparables rather than a single market label.
How do GTA buyers affect the Mount Forest real estate market?
GTA buyers continue to seek the affordability and lifestyle of Mount Forest. They bring strong purchasing power but rely heavily on online research. High-quality digital marketing is essential to capture their attention before they visit.
Watch: A Backstage Tour of the Seller Marketing Plan
This video is a backstage tour of the seller marketing plan. It shows how Video Narrated VR Animated Online Showings highlight all of a home's key features and benefits online — where buyers shortlist homes they are willing to go see. It does NOT discuss pricing or negotiation; it focuses on marketing exposure and the VR system.
How to Get Top Dollar for Your House
A backstage tour of the seller marketing plan, showing how Video Narrated VR Animated Online Showings highlight all of a home's key features and benefits online — where buyers shortlist homes they are willing to go see.
July 2026 Wellington North Market Context
The newest supplied monthly report is for Wellington North as a whole, including Mount Forest, Arthur and surrounding rural areas. It is useful current context, but it is not a Mount Forest-only dataset.
| Property Type | Sales | Average Price | Median Price | Active | Sale-to-List | LDOM |
|---|---|---|---|---|---|---|
| All Home Types | 19 | $536,126 | $520,000 | 90 | 96% | 52 |
| Detached | 14 | $540,779 | $531,200 | 64 | 96% | 54 |
| Semi-Detached | 1 | $407,500 | $407,500 | 8 | 95% | 29 |
| Condo Townhouse | 0 | — | — | 2 | — | — |
| Condo Apartment | 0 | — | — | 6 | — | — |
| Attached/Row/Townhouse | 4 | $552,000 | $544,000 | 10 | 97% | 49 |
From January through July 2026, Wellington North recorded 94 sales with $53,738,170 in dollar volume, an average price of $571,683, a median of $558,500, 243 new listings, a 97% sale-to-list-price ratio and 64 listing days on market. July's 90 active listings compared with 19 sales is about 4.7 active listings per sale, while 26 new listings compared with 19 sales is about 1.4 to 1. These are simple comparison ratios, not formal months-of-inventory calculations.
Source: TRREB Wellington Regional Housing Market Report, July 2026, Wellington North page 10. LDOM means listing days on market.
Latest Mount Forest-Specific Market Snapshot (Q1 2026)
The following figures are the newest Mount Forest-specific statistics supplied by the Toronto Regional Real Estate Board (TRREB). They cover January through March 2026 and should be read separately from the July Wellington North figures above.
The market saw 16 total sales in the quarter, generating $8.9 million in dollar volume. With 47 new listings entering the market and 40 active listings at quarter's end, the new-listing-to-sale ratio sits at 2.9, providing buyers with options while still rewarding sellers who price accurately.
Mount Forest Q1 Year-Over-Year Trends
Comparing the same quarter helps control for seasonality. Mount Forest's Q1 2026 data shows more sales, a lower average price, a higher median price and a shorter average marketing time than Q1 2025. Because only 16 sales were recorded, property mix can materially affect both average and median prices.
The median rose while the average declined slightly. That divergence confirms the two measures moved differently, but the report does not establish a single cause. With a small number of sales, changes in the mix of properties sold can move either figure. Average days on market improved from 63 to 57 days year over year.
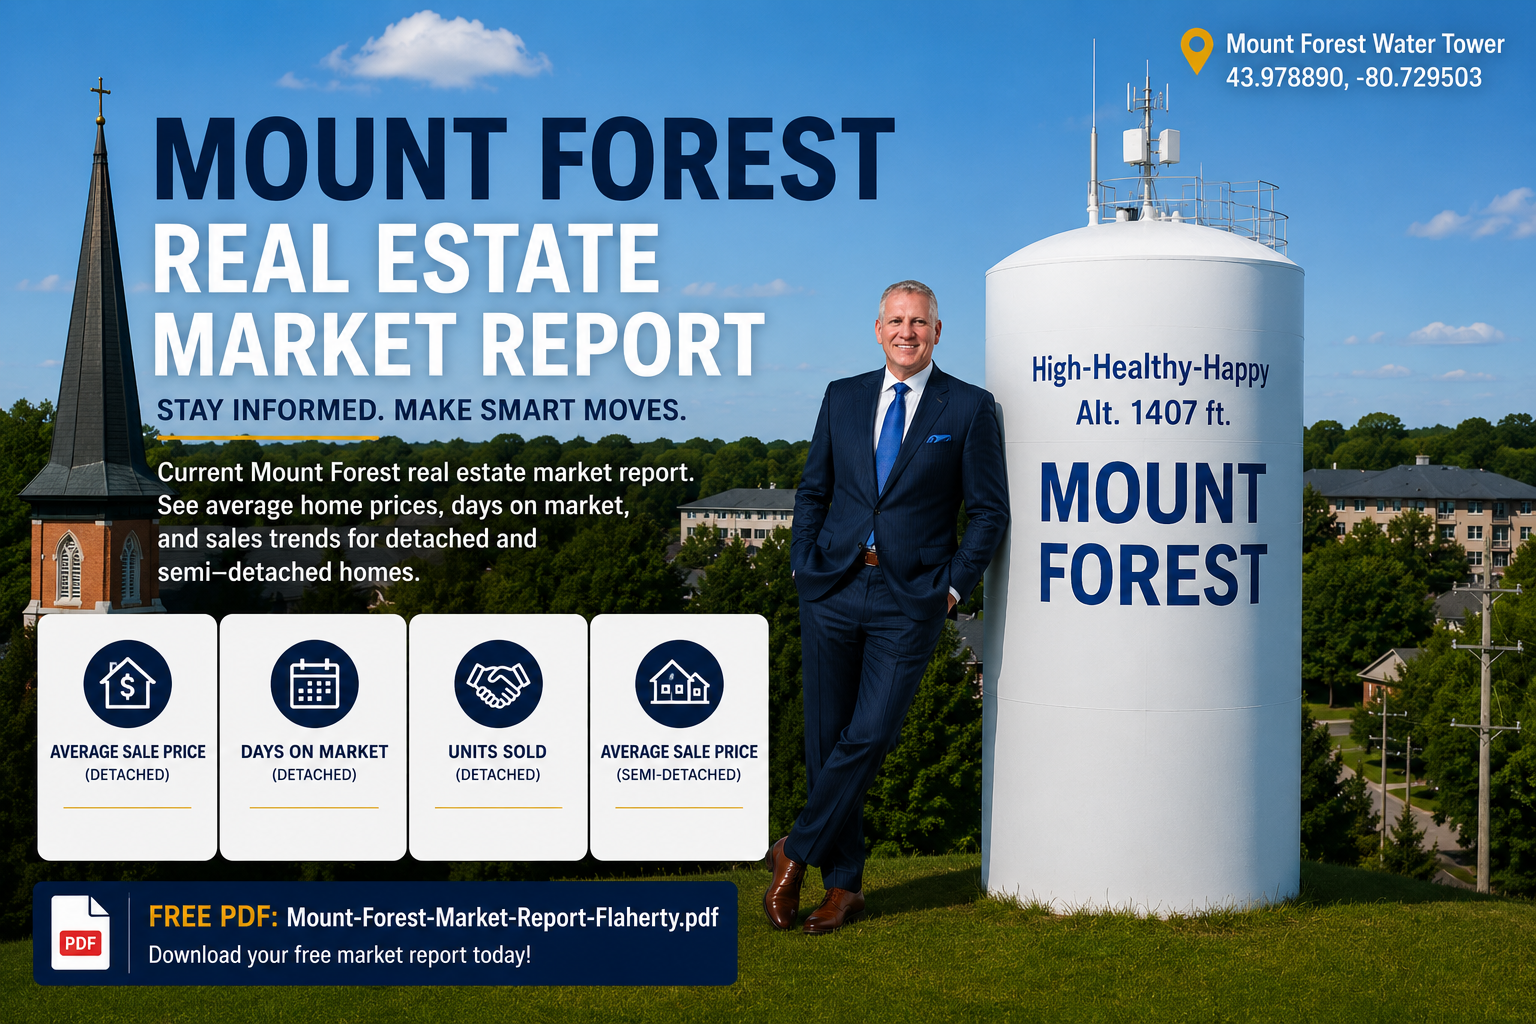
Click the image to download your free Mount Forest Market Strategy Guide.
Mount Forest Property Type Breakdown (Q1 2026)
Mount Forest is predominantly a detached home market, which is reflected clearly in the transaction data. Detached homes made up the vast majority of both sales and new inventory in the first quarter.
For detached homes, the sales-to-new-listings ratio sits at 35%, indicating a balanced market where buyers have choices, but well-presented properties move reliably. Detached homes are selling in an average of 49 days and achieving approximately 97% of their list price.
What This Means for Sellers
The data tells a clear story: buyers are active, but they are disciplined. The days of throwing a high price on a property and hoping for the best are gone. Sellers who price accurately based on recent comparables and invest in top-tier marketing are being rewarded with fast sales and strong offers.
Mount Forest had 40 active listings at the end of Q1, while the broader Wellington North market had 90 active listings in July. Your direct competition depends on property type, price range and location. Our Video Narrated VR Animated Online Showings allow buyers to tour the property virtually before booking a physical showing.
Mount Forest Home Value Calculators
Use these interactive tools to estimate your home's value and calculate your net proceeds from a sale. For a precise evaluation based on your specific property, request a free home evaluation.
What's My Home Worth?
Get a quick estimate based on the latest available Mount Forest-specific market data (Q1 2026). This is a starting point — a professional CMA from Kevin will give you the accurate number.
Net Proceeds Calculator
Estimate how much you will walk away with after selling. Enter your numbers below.
The Flaherty Advantage
When you list your Mount Forest home with the Flaherty Team, you benefit from a proven system designed to maximize your return:
- Sell for More: We sell homes for 99.2% of market value, putting an average of $13,358 more in our clients' pockets compared to average agents.
- Sell Faster: Our listings sell 52% faster than the average days on market.
- Massive Buyer Reach: We maintain a database of over 2,300 buyers actively looking to purchase within the next 3 months.
- Unmatched Exposure: Your home's custom webpage is syndicated to over 57 locations online.
Essential Viewing for Home Sellers
10 Questions You Should Ask Before Hiring A REALTOR
Ensure you are hiring the right professional to represent your property.
Why Didn't My House Sell?
Common pitfalls that cause homes to expire on the market and how to avoid them.
How to Avoid Legal Mistakes When Selling
Protect yourself during the sale process — Ontario's TRESA regulations require full disclosure.
Passing the Building Inspection
What inspectors look for and how to prepare your home for scrutiny.
What Our Clients Say
Read more success stories at flaherty.ca/reviews.
Resources for Mount Forest Sellers
Frequently Asked Questions About the Mount Forest Market
What is the current average house price in Mount Forest?
The latest Mount Forest-specific TRREB data is Q1 2026, when the average selling price was $556,375 and the median was $572,500. The newer July 2026 Wellington North report recorded a $536,126 average and $520,000 median across the wider township. Your home's value depends on recent comparable sales, property type, condition and location.
Are house prices in Mount Forest going up or down?
Mount Forest's Q1 2026 average price was 1.2% below Q1 2025 while its median was 9.9% higher. The July 2026 figures apply to Wellington North as a whole, so they should not be used as a direct month-to-quarter Mount Forest trend comparison.
How long is it taking to sell a house in Mount Forest right now?
Mount Forest properties averaged 57 days on market in Q1 2026. The newer July 2026 Wellington North report recorded 52 listing days on market across all home types. A property's likely selling time depends on its segment, price and presentation.
Is it currently a buyer's or seller's market?
July 2026 Wellington North had 90 active listings, 26 new listings, 19 sales and a 96% sale-to-list-price ratio. Buyers had meaningful selection, but a buyer's-versus-seller's label should be based on direct local and property-type comparables rather than a single calculated ratio.
What percentage of asking price are sellers getting?
Mount Forest sellers received 97% of list price on average in Q1 2026, while the broader Wellington North market recorded 96% in July 2026. Individual results depend on pricing, condition, property type and exposure.
How many homes are currently for sale in Mount Forest?
Mount Forest had 40 active listings at the end of Q1 2026. The newer July 2026 Wellington North report showed 90 active listings across the broader township; that number is not Mount Forest-only inventory.
What type of property sells best in Mount Forest?
Detached homes dominate the market, accounting for 13 of the 16 total sales in Q1 2026. They are the most sought-after property type in the area.
How does the rural Wellington North market compare to Mount Forest?
Rural properties in Wellington North command a premium, with an average price of $951,333 in Q1 2026. Kevin Flaherty points out that acreage, outbuildings, and location drive this higher valuation compared to in-town properties.
Are GTA buyers still moving to Wellington North?
Yes. Buyers from the Greater Toronto Area continue to look north for better affordability, larger lots, and a quieter lifestyle, remaining a key demographic for Mount Forest home sales.
How do I attract out-of-town buyers to my listing?
Out-of-town buyers rely heavily on digital research. Kevin Flaherty uses Video Narrated VR Animated Online Showings to give these buyers a complete, immersive tour of the home before they make the drive, significantly increasing out-of-town interest.
Should I wait until spring to list my house?
While spring traditionally sees more inventory, the Q1 data shows buyers are active early in the year. Listing when inventory is lower can sometimes result in less competition for your property.
What is the new-listing-to-sale ratio in Mount Forest?
Mount Forest recorded 47 new listings and 16 sales in Q1 2026, a 2.9-to-1 new-listing-to-sale ratio. Wellington North recorded 26 new listings and 19 sales in July, or about 1.4 to 1. These are simple activity ratios, not formal months-of-inventory calculations.
Why did the median price go up while the average price went down?
The figures confirm that the average and median moved in different directions, but they do not establish why. With only 16 Mount Forest sales in Q1 2026, a change in the mix of property types, locations or price ranges can materially affect both measures.
How many days on market is considered 'stale'?
Mount Forest averaged 57 days on market in Q1, while Wellington North recorded 52 listing days on market in July. A listing should be reviewed when it materially exceeds the normal exposure time for its own property type and price range or when showing and offer activity is weak.
Should I price my home higher to leave room for negotiation?
No. Overpricing is the most common reason homes fail to sell. Kevin coaches sellers to price accurately at fair market value to attract serious buyers immediately rather than scaring them away with an inflated price.
Are condo apartments selling well in Mount Forest?
The condo market is very small in Mount Forest. In Q1 2026, there were only 2 new listings and 2 sales for condo apartments, showing steady but low-volume activity.
How much are detached homes selling for?
The average selling price specifically for detached homes in Mount Forest was approximately $596,000 in Q1 2026, with a median of $595,000.
Do I need to renovate before selling in this market?
Not necessarily. While updates can help, you rarely recoup the full cost of major renovations. Kevin Flaherty recommends focusing on minor repairs, decluttering, and exceptional staging rather than expensive remodels.
How does the Flaherty Team's performance compare to the market average?
The Flaherty Team sells homes for 99.2% of market value and 52% faster than the industry average, consistently outperforming standard market metrics through superior marketing.
What is the sales volume for Mount Forest?
Mount Forest recorded $8,902,000 in dollar volume across 16 Q1 2026 sales. Wellington North recorded $10,186,400 across 19 sales in July and $53,738,170 across 94 sales from January through July.
How are semi-detached homes performing?
Mount Forest recorded no semi-detached sales and four new semi-detached listings in Q1 2026. The newer Wellington North July report recorded one semi-detached sale at $407,500, with two new listings and eight active listings.
How does Arthur's market compare to Mount Forest?
Arthur is a smaller market, with 5 sales in Q1 2026. However, its average price was higher at $683,200, and homes sold slightly faster at an average of 40 days on market.
Is staging important in the current Mount Forest and Wellington North market?
Yes. Mount Forest had 40 active listings at the end of Q1 and Wellington North had 90 active listings in July. Presentation helps a home compete within its own price range and property type, although it does not guarantee a particular selling time or price.
How do I find out the exact value of my home today?
The best approach is a custom Comparative Market Analysis (CMA). You can start by requesting a free, no-obligation home evaluation from our team to see exactly where your property fits into the current data.
Mount Forest Real Estate Resources
Explore our core Mount Forest resource pages and seller guides:

About Kevin Flaherty
Kevin Flaherty is a real estate broker with over 38 years of experience serving south-central Ontario. With a dedicated marketing team, Kevin utilizes proprietary Video Narrated VR Animated Online Showings to provide maximum exposure for his clients' properties. His proven system sells homes for 99.2% of market value and 52% faster than the industry average.
Call Kevin directly: 226-270-6433
Download the Market Strategy Guide